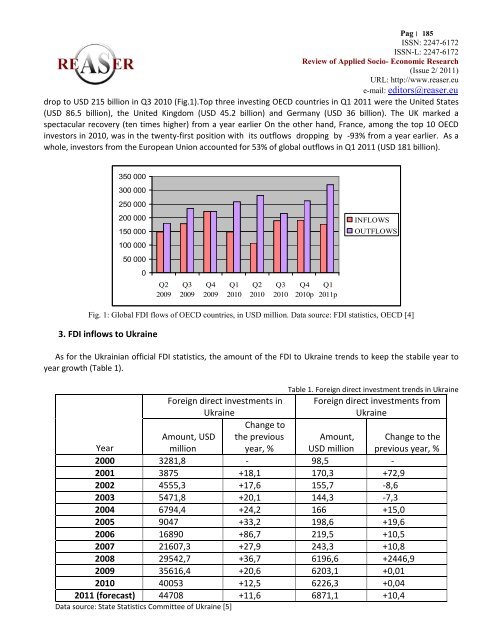
Pag׀ 184 ISSN: 2247-6172ISSN-L: 2247-6172<strong>Review</strong> <strong>of</strong> <strong>Applied</strong> <strong>Socio</strong>- <strong>Economic</strong> Research(Issue 2/ <strong>2011</strong>)URL: http://www.reaser.eue-mail: editors@reaser.euForeign direct investment inflows and macroeconomic risks in UkraineIuliia Tkachenko 11 PhD student at Kyiv National Taras Shevchenko UniversityAbstract. The research focuses on the analysis <strong>of</strong> the foreign direct investment (hereinafter FDI) inflows to Ukraine and themacroeconomic risks connected with investing. According to the State Committee <strong>of</strong> Statistics, the largest FDI inflows toUkraine as <strong>of</strong> January 1, <strong>2011</strong> were from Cyprus, with 22.2% <strong>of</strong> cumulative FDI, Germany with 15.8%, the Netherlands with10.5%, Russia with 7.6%, Austria with 5.9%, France with 5.3% and the United Kingdom with 5.1%. The lion’s share <strong>of</strong> FDI toUkraine was invested in the financial services and industry sector: USD 15 billion or 33.7% <strong>of</strong> total FDI and USD 14 billion or31.4% <strong>of</strong> total FDI respectively.There are several key macroeconomic risks for foreign investors to Ukrainian economy. The critical external factors forUkraine’s economy include global commodities prices, primarily steel and oil and global appetite for emerging markets debt.Regardless before mentioned risks, according to the United Nations trade and development body annual report on global FDI,Ukraine is the leader among the Commonwealth <strong>of</strong> Independent States (hereinafter CIS) countries in the FDI growth. FDI flowinto Ukrainian economy increased by 35% up to USD 6.5 billion in 2010, making Ukraine one <strong>of</strong> the leading investmentrecipients in the CIS region. Recently, the global rating agency Fitch Ratings raised Ukraine's long-term foreign credit ratingfrom stable to positive. Notably, according to the World Investment Report <strong>2011</strong>, the Ukrainian FDI flow constitutes 23% <strong>of</strong>gross fixed capital formation. At the same time, the average rate for the CIS is 15.1% and for the world – 9.1%.Keywords: FDI inflows to Ukraine, macroeconomic risks, Ukrainian economyJEL Codes: F02, F21, F36, F43, F471. IntroductionFDI is generally considered as a driving force in the integration <strong>of</strong> developing countries into the globalizationprocess that characterizes the world economy. Although most FDI is concentrated in developed countries,developing countries have made the biggest gains in the 1990s in terms <strong>of</strong> flows <strong>of</strong> inward FDI.OECD Benchmark Definition <strong>of</strong> the FDI [2] determine it as a category <strong>of</strong> investment that reflects the objective<strong>of</strong> establishing a lasting interest by a resident enterprise in one economy (direct investor) in an enterprise (directinvestment enterprise) that is resident in an economy other than that <strong>of</strong> the direct investor. The lasting interestimplies the existence <strong>of</strong> a long-term relationship between the direct investor and the direct investment enterpriseand a significant degree <strong>of</strong> influence (not necessarily control) on the management <strong>of</strong> the enterprise. The direct orindirect ownership <strong>of</strong> 10% or more <strong>of</strong> the voting power <strong>of</strong> an enterprise resident in one economy by an investorresident in another economy is the statistical evidence <strong>of</strong> such a relationship.2. Global investment trendsIt is mentioned in the OECD “FDI IN FIGURES” [3] that according to preliminary estimates, in the first quarter<strong>2011</strong> worldwide FDI activity remained stable and did not confirm the upward trend observed in the last quarter <strong>of</strong>2010. FDI outflows for the first quarter <strong>2011</strong> were USD 343 billion, representing a 9% increase from a year earlierbut a 2% decline compared to the fourth quarter 2010 when they reached USD 350 billion (representing a 28%increase from the Q3 2010). The share <strong>of</strong> OECD investors, which accounted for around 80% <strong>of</strong> global FDI outflowsin 2010, rose in the first quarter <strong>of</strong> <strong>2011</strong> to reach around 90% <strong>of</strong> world investments. This resulted from twoconsecutive increases <strong>of</strong> OECD’s FDI outflows in Q4 2010 and Q1 <strong>2011</strong>, each time by 22%, contrasting with a 24%
Pag׀ 185 ISSN: 2247-6172ISSN-L: 2247-6172<strong>Review</strong> <strong>of</strong> <strong>Applied</strong> <strong>Socio</strong>- <strong>Economic</strong> Research(Issue 2/ <strong>2011</strong>)URL: http://www.reaser.eue-mail: editors@reaser.eudrop to USD 215 billion in Q3 2010 (Fig.1).Top three investing OECD countries in Q1 <strong>2011</strong> were the United States(USD 86.5 billion), the United Kingdom (USD 45.2 billion) and Germany (USD 36 billion). The UK marked aspectacular recovery (ten times higher) from a year earlier On the other hand, France, among the top 10 OECDinvestors in 2010, was in the twenty-first position with its outflows dropping by -93% from a year earlier. As awhole, investors from the European Union accounted for 53% <strong>of</strong> global outflows in Q1 <strong>2011</strong> (USD 181 billion).350 000300 000250 000200 000150 000INFLOWSOUTFLOWS100 00050 0000Q22009Q32009Q42009Q12010Q22010Q32010Q42010pQ1<strong>2011</strong>pFig. 1: Global FDI flows <strong>of</strong> OECD countries, in USD million. Data source: FDI statistics, OECD [4]3. FDI inflows to UkraineAs for the Ukrainian <strong>of</strong>ficial FDI statistics, the amount <strong>of</strong> the FDI to Ukraine trends to keep the stabile year toyear growth (Table 1).Table 1. Foreign direct investment trends in UkraineForeign direct investments inUkraineForeign direct investments fromUkraineYearAmount, USDmillionChange tothe previousyear, %Amount,USD millionChange to theprevious year, %2000 3281,8 - 98,5 -2001 3875 +18,1 170,3 +72,92002 4555,3 +17,6 155,7 -8,62003 5471,8 +20,1 144,3 -7,32004 6794,4 +24,2 166 +15,02005 9047 +33,2 198,6 +19,62006 16890 +86,7 219,5 +10,52007 21607,3 +27,9 243,3 +10,82008 29542,7 +36,7 6196,6 +2446,92009 35616,4 +20,6 6203,1 +0,012010 40053 +12,5 6226,3 +0,04<strong>2011</strong> (forecast) 44708 +11,6 6871,1 +10,4Data source: State Statistics Committee <strong>of</strong> Ukraine [5]