Volume 2, ISSUE2/2011 - Review of Applied Socio-Economic ...
Volume 2, ISSUE2/2011 - Review of Applied Socio-Economic ...
Volume 2, ISSUE2/2011 - Review of Applied Socio-Economic ...

You also want an ePaper? Increase the reach of your titles
YUMPU automatically turns print PDFs into web optimized ePapers that Google loves.
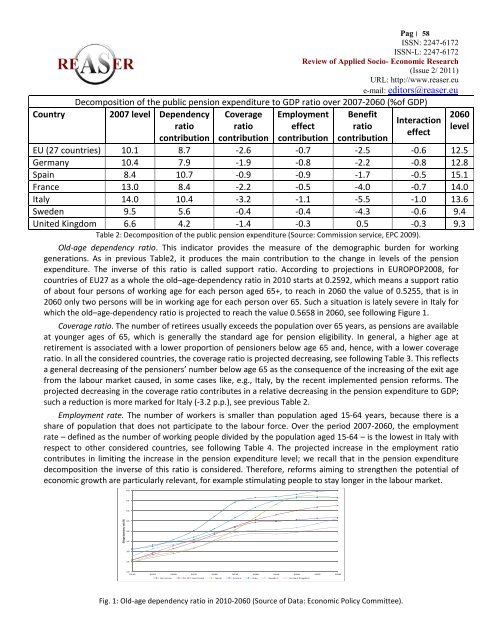
CountryPag׀ 58 ISSN: 2247-6172ISSN-L: 2247-6172<strong>Review</strong> <strong>of</strong> <strong>Applied</strong> <strong>Socio</strong>- <strong>Economic</strong> Research(Issue 2/ <strong>2011</strong>)URL: http://www.reaser.eue-mail: editors@reaser.euDecomposition <strong>of</strong> the public pension expenditure to GDP ratio over 2007-2060 (%<strong>of</strong> GDP)2007 level Dependency Coverage Employment BenefitInteractionratio ratio effect ratioeffectcontribution contribution contribution contributionEU (27 countries) 10.1 8.7 -2.6 -0.7 -2.5 -0.6 12.5Germany 10.4 7.9 -1.9 -0.8 -2.2 -0.8 12.8Spain 8.4 10.7 -0.9 -0.9 -1.7 -0.5 15.1France 13.0 8.4 -2.2 -0.5 -4.0 -0.7 14.0Italy 14.0 10.4 -3.2 -1.1 -5.5 -1.0 13.6Sweden 9.5 5.6 -0.4 -0.4 -4.3 -0.6 9.4United Kingdom 6.6 4.2 -1.4 -0.3 0.5 -0.3 9.3Table 2: Decomposition <strong>of</strong> the public pension expenditure (Source: Commission service, EPC 2009).Old-age dependency ratio. This indicator provides the measure <strong>of</strong> the demographic burden for workinggenerations. As in previous Table2, it produces the main contribution to the change in levels <strong>of</strong> the pensionexpenditure. The inverse <strong>of</strong> this ratio is called support ratio. According to projections in EUROPOP2008, forcountries <strong>of</strong> EU27 as a whole the old–age-dependency ratio in 2010 starts at 0.2592, which means a support ratio<strong>of</strong> about four persons <strong>of</strong> working age for each person aged 65+, to reach in 2060 the value <strong>of</strong> 0.5255, that is in2060 only two persons will be in working age for each person over 65. Such a situation is lately severe in Italy forwhich the old–age-dependency ratio is projected to reach the value 0.5658 in 2060, see following Figure 1.Coverage ratio. The number <strong>of</strong> retirees usually exceeds the population over 65 years, as pensions are availableat younger ages <strong>of</strong> 65, which is generally the standard age for pension eligibility. In general, a higher age atretirement is associated with a lower proportion <strong>of</strong> pensioners below age 65 and, hence, with a lower coverageratio. In all the considered countries, the coverage ratio is projected decreasing, see following Table 3. This reflectsa general decreasing <strong>of</strong> the pensioners’ number below age 65 as the consequence <strong>of</strong> the increasing <strong>of</strong> the exit agefrom the labour market caused, in some cases like, e.g., Italy, by the recent implemented pension reforms. Theprojected decreasing in the coverage ratio contributes in a relative decreasing in the pension expenditure to GDP;such a reduction is more marked for Italy (-3.2 p.p.), see previous Table 2.Employment rate. The number <strong>of</strong> workers is smaller than population aged 15-64 years, because there is ashare <strong>of</strong> population that does not participate to the labour force. Over the period 2007-2060, the employmentrate – defined as the number <strong>of</strong> working people divided by the population aged 15-64 – is the lowest in Italy withrespect to other considered countries, see following Table 4. The projected increase in the employment ratiocontributes in limiting the increase in the pension expenditure level; we recall that in the pension expendituredecomposition the inverse <strong>of</strong> this ratio is considered. Therefore, reforms aiming to strengthen the potential <strong>of</strong>economic growth are particularly relevant, for example stimulating people to stay longer in the labour market.602060level5550Old-age dependency ratio (%)4540353025202010 2015 2020 2025 2030 2035 2040 2045 2050 2055 2060Germany EU (27 countries) Spain France Italy Sweden United KingdomFig. 1: Old-age dependency ratio in 2010-2060 (Source <strong>of</strong> Data: <strong>Economic</strong> Policy Committee).