South Lakeland Health Improvement Plan - NHS Cumbria
South Lakeland Health Improvement Plan - NHS Cumbria
South Lakeland Health Improvement Plan - NHS Cumbria

Create successful ePaper yourself
Turn your PDF publications into a flip-book with our unique Google optimized e-Paper software.
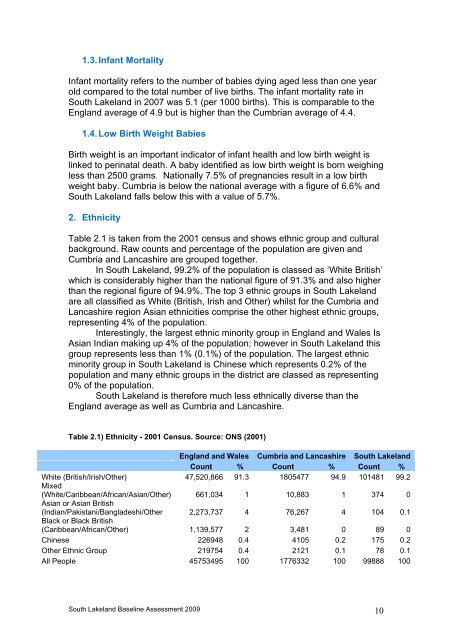
1.3. Infant MortalityInfant mortality refers to the number of babies dying aged less than one yearold compared to the total number of live births. The infant mortality rate in<strong>South</strong> <strong>Lakeland</strong> in 2007 was 5.1 (per 1000 births). This is comparable to theEngland average of 4.9 but is higher than the <strong>Cumbria</strong>n average of 4.4.1.4. Low Birth Weight BabiesBirth weight is an important indicator of infant health and low birth weight islinked to perinatal death. A baby identified as low birth weight is born weighingless than 2500 grams. Nationally 7.5% of pregnancies result in a low birthweight baby. <strong>Cumbria</strong> is below the national average with a figure of 6.6% and<strong>South</strong> <strong>Lakeland</strong> falls below this with a value of 5.7%.2. EthnicityTable 2.1 is taken from the 2001 census and shows ethnic group and culturalbackground. Raw counts and percentage of the population are given and<strong>Cumbria</strong> and Lancashire are grouped together.In <strong>South</strong> <strong>Lakeland</strong>, 99.2% of the population is classed as ‘White British’which is considerably higher than the national figure of 91.3% and also higherthan the regional figure of 94.9%. The top 3 ethnic groups in <strong>South</strong> <strong>Lakeland</strong>are all classified as White (British, Irish and Other) whilst for the <strong>Cumbria</strong> andLancashire region Asian ethnicities comprise the other highest ethnic groups,representing 4% of the population.Interestingly, the largest ethnic minority group in England and Wales IsAsian Indian making up 4% of the population; however in <strong>South</strong> <strong>Lakeland</strong> thisgroup represents less than 1% (0.1%) of the population. The largest ethnicminority group in <strong>South</strong> <strong>Lakeland</strong> is Chinese which represents 0.2% of thepopulation and many ethnic groups in the district are classed as representing0% of the population.<strong>South</strong> <strong>Lakeland</strong> is therefore much less ethnically diverse than theEngland average as well as <strong>Cumbria</strong> and Lancashire.Table 2.1) Ethnicity - 2001 Census. Source: ONS (2001)England and Wales <strong>Cumbria</strong> and Lancashire <strong>South</strong> <strong>Lakeland</strong>Count % Count % Count %White (British/Irish/Other) 47,520,866 91.3 1805477 94.9 101481 99.2Mixed(White/Caribbean/African/Asian/Other) 661,034 1 10,883 1 374 0Asian or Asian British(Indian/Pakistani/Bangladeshi/Other 2,273,737 4 76,267 4 104 0.1Black or Black British(Caribbean/African/Other) 1,139,577 2 3,481 0 89 0Chinese 226948 0.4 4105 0.2 175 0.2Other Ethnic Group 219754 0.4 2121 0.1 78 0.1All People 45753495 100 1776332 100 99888 100<strong>South</strong> <strong>Lakeland</strong> Baseline Assessment 2009 10