South Lakeland Health Improvement Plan - NHS Cumbria
South Lakeland Health Improvement Plan - NHS Cumbria
South Lakeland Health Improvement Plan - NHS Cumbria

Create successful ePaper yourself
Turn your PDF publications into a flip-book with our unique Google optimized e-Paper software.
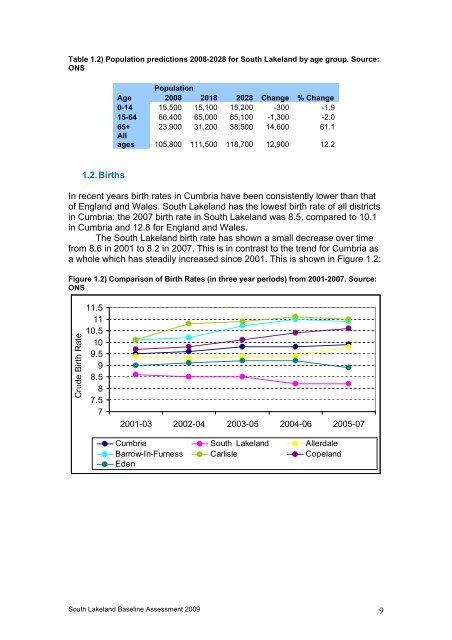
Table 1.2) Population predictions 2008-2028 for <strong>South</strong> <strong>Lakeland</strong> by age group. Source:ONSPopulationAge 2008 2018 2028 Change % Change0-14 15,500 15,100 15,200 -300 -1.915-64 66,400 65,000 65,100 -1,300 -2.065+ 23,900 31,200 38,500 14,600 61.1Allages 105,800 111,500 118,700 12,900 12.21.2. BirthsIn recent years birth rates in <strong>Cumbria</strong> have been consistently lower than thatof England and Wales. <strong>South</strong> <strong>Lakeland</strong> has the lowest birth rate of all districtsin <strong>Cumbria</strong>: the 2007 birth rate in <strong>South</strong> <strong>Lakeland</strong> was 8.5, compared to 10.1in <strong>Cumbria</strong> and 12.8 for England and Wales.The <strong>South</strong> <strong>Lakeland</strong> birth rate has shown a small decrease over timefrom 8.6 in 2001 to 8.2 in 2007. This is in contrast to the trend for <strong>Cumbria</strong> asa whole which has steadily increased since 2001. This is shown in Figure 1.2:Figure 1.2) Comparison of Birth Rates (in three year periods) from 2001-2007. Source:ONSCrude Birth Rate11.51110.5109.598.587.572001-03 2002-04 2003-05 2004-06 2005-07<strong>Cumbria</strong> <strong>South</strong> <strong>Lakeland</strong> AllerdaleBarrow-In-Furness Carlisle CopelandEden<strong>South</strong> <strong>Lakeland</strong> Baseline Assessment 2009 9