South Lakeland Health Improvement Plan - NHS Cumbria
South Lakeland Health Improvement Plan - NHS Cumbria
South Lakeland Health Improvement Plan - NHS Cumbria
Create successful ePaper yourself
Turn your PDF publications into a flip-book with our unique Google optimized e-Paper software.
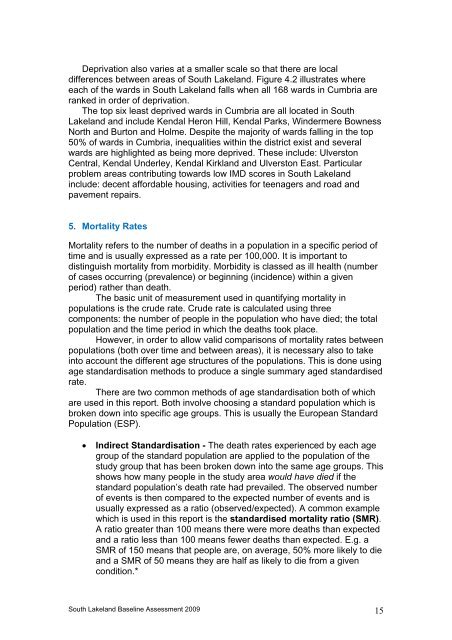
Deprivation also varies at a smaller scale so that there are localdifferences between areas of <strong>South</strong> <strong>Lakeland</strong>. Figure 4.2 illustrates whereeach of the wards in <strong>South</strong> <strong>Lakeland</strong> falls when all 168 wards in <strong>Cumbria</strong> areranked in order of deprivation.The top six least deprived wards in <strong>Cumbria</strong> are all located in <strong>South</strong><strong>Lakeland</strong> and include Kendal Heron Hill, Kendal Parks, Windermere BownessNorth and Burton and Holme. Despite the majority of wards falling in the top50% of wards in <strong>Cumbria</strong>, inequalities within the district exist and severalwards are highlighted as being more deprived. These include: UlverstonCentral, Kendal Underley, Kendal Kirkland and Ulverston East. Particularproblem areas contributing towards low IMD scores in <strong>South</strong> <strong>Lakeland</strong>include: decent affordable housing, activities for teenagers and road andpavement repairs.5. Mortality RatesMortality refers to the number of deaths in a population in a specific period oftime and is usually expressed as a rate per 100,000. It is important todistinguish mortality from morbidity. Morbidity is classed as ill health (numberof cases occurring (prevalence) or beginning (incidence) within a givenperiod) rather than death.The basic unit of measurement used in quantifying mortality inpopulations is the crude rate. Crude rate is calculated using threecomponents: the number of people in the population who have died; the totalpopulation and the time period in which the deaths took place.However, in order to allow valid comparisons of mortality rates betweenpopulations (both over time and between areas), it is necessary also to takeinto account the different age structures of the populations. This is done usingage standardisation methods to produce a single summary aged standardisedrate.There are two common methods of age standardisation both of whichare used in this report. Both involve choosing a standard population which isbroken down into specific age groups. This is usually the European StandardPopulation (ESP).• Indirect Standardisation - The death rates experienced by each agegroup of the standard population are applied to the population of thestudy group that has been broken down into the same age groups. Thisshows how many people in the study area would have died if thestandard population’s death rate had prevailed. The observed numberof events is then compared to the expected number of events and isusually expressed as a ratio (observed/expected). A common examplewhich is used in this report is the standardised mortality ratio (SMR).A ratio greater than 100 means there were more deaths than expectedand a ratio less than 100 means fewer deaths than expected. E.g. aSMR of 150 means that people are, on average, 50% more likely to dieand a SMR of 50 means they are half as likely to die from a givencondition.*<strong>South</strong> <strong>Lakeland</strong> Baseline Assessment 2009 15


