South Lakeland Health Improvement Plan - NHS Cumbria
South Lakeland Health Improvement Plan - NHS Cumbria
South Lakeland Health Improvement Plan - NHS Cumbria

Create successful ePaper yourself
Turn your PDF publications into a flip-book with our unique Google optimized e-Paper software.
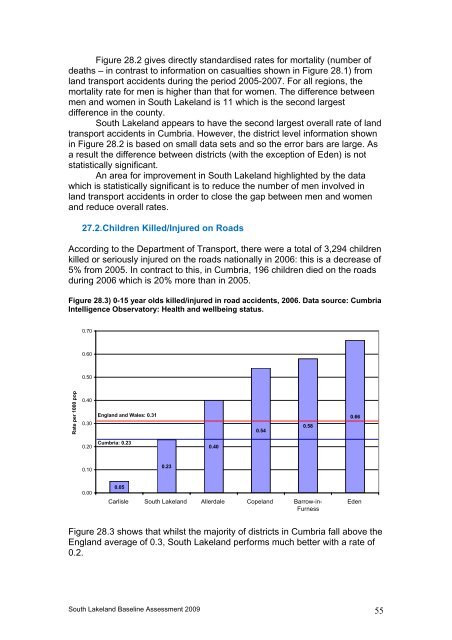
Figure 28.2 gives directly standardised rates for mortality (number ofdeaths – in contrast to information on casualties shown in Figure 28.1) fromland transport accidents during the period 2005-2007. For all regions, themortality rate for men is higher than that for women. The difference betweenmen and women in <strong>South</strong> <strong>Lakeland</strong> is 11 which is the second largestdifference in the county.<strong>South</strong> <strong>Lakeland</strong> appears to have the second largest overall rate of landtransport accidents in <strong>Cumbria</strong>. However, the district level information shownin Figure 28.2 is based on small data sets and so the error bars are large. Asa result the difference between districts (with the exception of Eden) is notstatistically significant.An area for improvement in <strong>South</strong> <strong>Lakeland</strong> highlighted by the datawhich is statistically significant is to reduce the number of men involved inland transport accidents in order to close the gap between men and womenand reduce overall rates.27.2. Children Killed/Injured on RoadsAccording to the Department of Transport, there were a total of 3,294 childrenkilled or seriously injured on the roads nationally in 2006: this is a decrease of5% from 2005. In contract to this, in <strong>Cumbria</strong>, 196 children died on the roadsduring 2006 which is 20% more than in 2005.Figure 28.3) 0-15 year olds killed/injured in road accidents, 2006. Data source: <strong>Cumbria</strong>Intelligence Observatory: <strong>Health</strong> and wellbeing status.0.700.600.50p1000 poRate per0.400.30England and Wales: 0.310.540.580.660.20<strong>Cumbria</strong>: 0.230.400.100.230.000.05Carlisle <strong>South</strong> <strong>Lakeland</strong> Allerdale Copeland Barrow-in-FurnessEdenFigure 28.3 shows that whilst the majority of districts in <strong>Cumbria</strong> fall above theEngland average of 0.3, <strong>South</strong> <strong>Lakeland</strong> performs much better with a rate of0.2.<strong>South</strong> <strong>Lakeland</strong> Baseline Assessment 2009 55