South Lakeland Health Improvement Plan - NHS Cumbria
South Lakeland Health Improvement Plan - NHS Cumbria
South Lakeland Health Improvement Plan - NHS Cumbria

You also want an ePaper? Increase the reach of your titles
YUMPU automatically turns print PDFs into web optimized ePapers that Google loves.
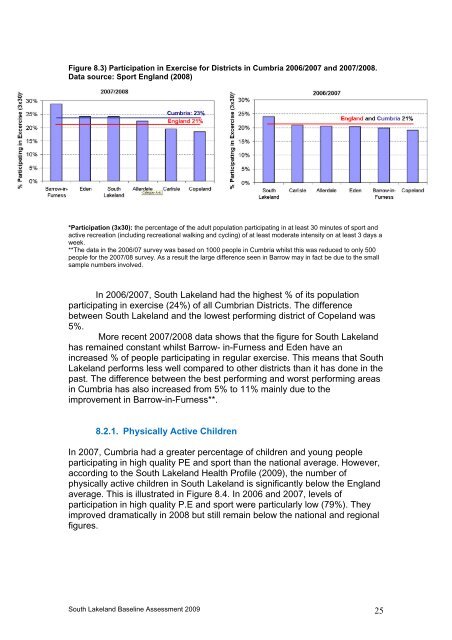
Figure 8.3) Participation in Exercise for Districts in <strong>Cumbria</strong> 2006/2007 and 2007/2008.Data source: Sport England (2008)*Participation (3x30): the percentage of the adult population participating in at least 30 minutes of sport andactive recreation (including recreational walking and cycling) of at least moderate intensity on at least 3 days aweek.**The data in the 2006/07 survey was based on 1000 people in <strong>Cumbria</strong> whilst this was reduced to only 500people for the 2007/08 survey. As a result the large difference seen in Barrow may in fact be due to the smallsample numbers involved.In 2006/2007, <strong>South</strong> <strong>Lakeland</strong> had the highest % of its populationparticipating in exercise (24%) of all <strong>Cumbria</strong>n Districts. The differencebetween <strong>South</strong> <strong>Lakeland</strong> and the lowest performing district of Copeland was5%.More recent 2007/2008 data shows that the figure for <strong>South</strong> <strong>Lakeland</strong>has remained constant whilst Barrow- in-Furness and Eden have anincreased % of people participating in regular exercise. This means that <strong>South</strong><strong>Lakeland</strong> performs less well compared to other districts than it has done in thepast. The difference between the best performing and worst performing areasin <strong>Cumbria</strong> has also increased from 5% to 11% mainly due to theimprovement in Barrow-in-Furness**.8.2.1. Physically Active ChildrenIn 2007, <strong>Cumbria</strong> had a greater percentage of children and young peopleparticipating in high quality PE and sport than the national average. However,according to the <strong>South</strong> <strong>Lakeland</strong> <strong>Health</strong> Profile (2009), the number ofphysically active children in <strong>South</strong> <strong>Lakeland</strong> is significantly below the Englandaverage. This is illustrated in Figure 8.4. In 2006 and 2007, levels ofparticipation in high quality P.E and sport were particularly low (79%). Theyimproved dramatically in 2008 but still remain below the national and regionalfigures.<strong>South</strong> <strong>Lakeland</strong> Baseline Assessment 2009 25