South Lakeland Health Improvement Plan - NHS Cumbria
South Lakeland Health Improvement Plan - NHS Cumbria
South Lakeland Health Improvement Plan - NHS Cumbria

You also want an ePaper? Increase the reach of your titles
YUMPU automatically turns print PDFs into web optimized ePapers that Google loves.
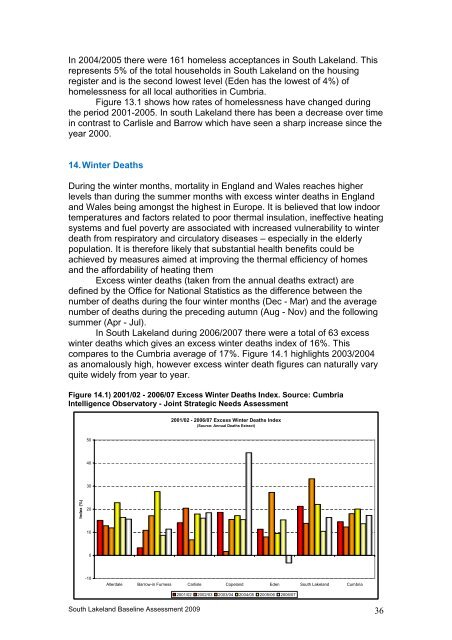
In 2004/2005 there were 161 homeless acceptances in <strong>South</strong> <strong>Lakeland</strong>. Thisrepresents 5% of the total households in <strong>South</strong> <strong>Lakeland</strong> on the housingregister and is the second lowest level (Eden has the lowest of 4%) ofhomelessness for all local authorities in <strong>Cumbria</strong>.Figure 13.1 shows how rates of homelessness have changed duringthe period 2001-2005. In south <strong>Lakeland</strong> there has been a decrease over timein contrast to Carlisle and Barrow which have seen a sharp increase since theyear 2000.14. Winter DeathsDuring the winter months, mortality in England and Wales reaches higherlevels than during the summer months with excess winter deaths in Englandand Wales being amongst the highest in Europe. It is believed that low indoortemperatures and factors related to poor thermal insulation, ineffective heatingsystems and fuel poverty are associated with increased vulnerability to winterdeath from respiratory and circulatory diseases – especially in the elderlypopulation. It is therefore likely that substantial health benefits could beachieved by measures aimed at improving the thermal efficiency of homesand the affordability of heating themExcess winter deaths (taken from the annual deaths extract) aredefined by the Office for National Statistics as the difference between thenumber of deaths during the four winter months (Dec - Mar) and the averagenumber of deaths during the preceding autumn (Aug - Nov) and the followingsummer (Apr - Jul).In <strong>South</strong> <strong>Lakeland</strong> during 2006/2007 there were a total of 63 excesswinter deaths which gives an excess winter deaths index of 16%. Thiscompares to the <strong>Cumbria</strong> average of 17%. Figure 14.1 highlights 2003/2004as anomalously high, however excess winter death figures can naturally varyquite widely from year to year.Figure 14.1) 2001/02 - 2006/07 Excess Winter Deaths Index. Source: <strong>Cumbria</strong>Intelligence Observatory - Joint Strategic Needs Assessment2001/02 - 2006/07 Excess Winter Deaths Index(Source: Annual Deaths Extract)504030Index (%)20100-10Allerdale Barrow-in Furness Carlisle Copeland Eden <strong>South</strong> <strong>Lakeland</strong> <strong>Cumbria</strong>2001/02 2002/03 2003/04 2004/05 2005/06 2006/07<strong>South</strong> <strong>Lakeland</strong> Baseline Assessment 2009 36