Sisal Annual Report 2011 - Permira
Sisal Annual Report 2011 - Permira
Sisal Annual Report 2011 - Permira
- No tags were found...

Create successful ePaper yourself
Turn your PDF publications into a flip-book with our unique Google optimized e-Paper software.
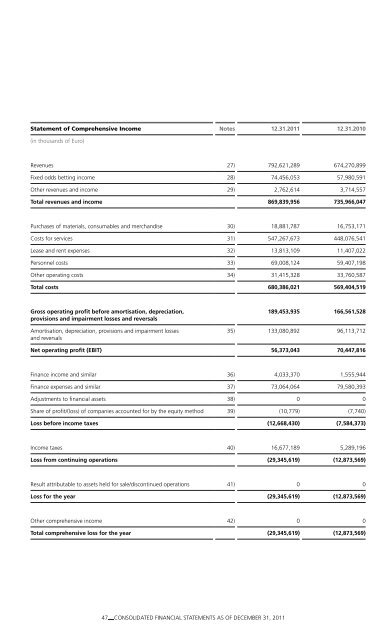
Statement of Comprehensive Income Notes 12.31.<strong>2011</strong> 12.31.2010(in thousands of Euro)Revenues 27) 792,621,289 674,270,899Fixed odds betting income 28) 74,456,053 57,980,591Other revenues and income 29) 2,762,614 3,714,557Total revenues and income 869,839,956 735,966,047Purchases of materials, consumables and merchandise 30) 18,881,787 16,753,171Costs for services 31) 547,267,673 448,076,541Lease and rent expenses 32) 13,813,109 11,407,022Personnel costs 33) 69,008,124 59,407,198Other operating costs 34) 31,415,328 33,760,587Total costs 680,386,021 569,404,519Gross operating profit before amortisation, depreciation,provisions and impairment losses and reversalsAmortisation, depreciation, provisions and impairment lossesand reversals189,453,935 166,561,52835) 133,080,892 96,113,712Net operating profit (EBIT) 56,373,043 70,447,816Finance income and similar 36) 4,033,370 1,555,944Finance expenses and similar 37) 73,064,064 79,580,393Adjustments to financial assets 38) 0 0Share of profit/(loss) of companies accounted for by the equity method 39) (10,779) (7,740)Loss before income taxes (12,668,430) (7,584,373)Income taxes 40) 16,677,189 5,289,196Loss from continuing operations (29,345,619) (12,873,569)Result attributable to assets held for sale/discontinued operations 41) 0 0Loss for the year (29,345,619) (12,873,569)Other comprehensive income 42) 0 0Total comprehensive loss for the year (29,345,619) (12,873,569)47 CONSOLIDATED FINANCIAL STATEMENTS AS OF DECEMBER 31, <strong>2011</strong>