Organizational Behaviour Comportement Organisationnel
Organizational Behaviour Comportement Organisationnel
Organizational Behaviour Comportement Organisationnel

Create successful ePaper yourself
Turn your PDF publications into a flip-book with our unique Google optimized e-Paper software.
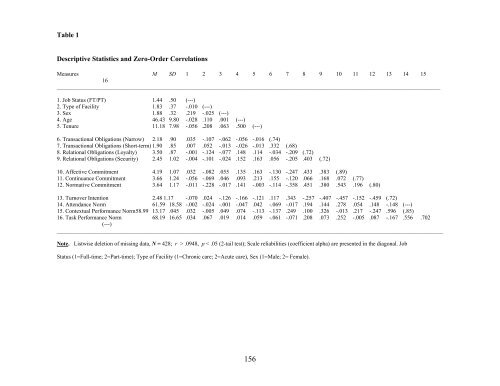
Table 1Descriptive Statistics and Zero-Order CorrelationsMeasures M SD 1 2 3 4 5 6 7 8 9 10 11 12 13 14 1516_______________________________________________________________________________________________________________________________________1. Job Status (FT/PT) 1.44 .50 (---)2. Type of Facility 1.83 .37 -.010 (---)3. Sex 1.88 .32 .219 -.025 (---)4. Age 46.43 9.80 -.028 .110 .001 (---)5. Tenure 11.18 7.98 -.056 .208 .063 .500 (---)6. Transactional Obligations (Narrow) 2.18 .90 .035 -.107 -.062 -.056 -.016 (.74)7. Transactional Obligations (Short-term) 1.90 .85 .007 .052 -.013 -.026 -.013 .332 (.68)8. Relational Obligations (Loyalty) 3.50 .87 -.001 -.124 -.077 .148 .114 -.034 -.209 (.72)9. Relational Obligations (Security) 2.45 1.02 -.004 -.101 -.024 .152 .163 .056 -.205 .403 (.72)10. Affective Commitment 4.19 1.07 .032 -.082 .055 .135 .163 -.130 -.247 .433 .383 (.89)11. Continuance Commitment 3.66 1.24 -.056 -.069 .046 .093 .213 .155 -.120 .066 .168 .072 (.77)12. Normative Commitment 3.64 1.17 -.011 -.228 -.017 .141 -.003 -.114 -.358 .451 .380 .543 .196 (.80)13. Turnover Intention 2.48 1.17 -.070 .024 -.126 -.166 -.121 .117 .343 -.257 -.407 -.457 -.152 -.459 (.72)14. Attendance Norm 61.59 18.58 -.002 -.024 -.001 -.047 .042 -.069 -.017 .194 .144 .278 .054 .148 -.148 (---)15. Contextual Performance Norm 58.99 13.17 .045 .032 -.005 .049 .074 -.113 -.137 .249 .100 .326 -.013 .217 -.247 .596 (.85)16. Task Performance Norm 68.19 16.65 .034 .067 .019 .014 .059 -.061 -.071 .208 .073 .252 -.005 .087 -.167 .556 .702(---)________________________________________________________________________________________________________________________________________Note. Listwise deletion of missing data, N = 428; r > .0948, p < .05 (2-tail test); Scale reliabilities (coefficient alpha) are presented in the diagonal. JobStatus (1=Full-time; 2=Part-time); Type of Facility (1=Chronic care; 2=Acute care), Sex (1=Male; 2= Female).156