presented with a complete list of all members of his or her work unit and then asked questionsabout the relationships with them. Two relationships were measured that are associated withsocial referent choice in organizations (Shah, 1998). First, friendships were measured tooperationalize expressive relationships by asking “who do you consider a personal friend?”Second, advice seeking was measured to operationalize instrumental relationships by asking“who do you ask for advice with work related matters?” For each question, respondents simplychose “yes” or “no” for each of their colleagues to indicate the presence or absence of a particularrelationship. Table 1 shows summary statistics of these sociometric data.Using UCINET IV (Borgatti et al., 1999), the data were then converted into dyadicindices of the way in which two actors relate to each other in a social network. These variablesoperationalized the mechanism through which actors are subject to direct and indirect socialinfluence in a social network (Johanson, 2000). Direct social influence between two individualswas calculated as a mutual relationship, in which the potential for reciprocal communication andassociation between them exists. Following common methods in influence studies (Meyer, 1994;Johanson, 2000), this variable was created by retaining a given relationship between two actors ina given work unit if both chose each other as a friend or if they both indicated that they ask eachother for advice. Please note that given this measure, a significant social influence effect isindicated by a negative relationship with the dependent variables, which measure dissimilarity ofbehavior.Indirect social influence was computed as structural equivalence, which examines theextent to which a given pair of actors exhibited similar patterns of giving and receivingrelationship choices (i.e., friendship or advice) with the same other individuals in their work unit(Burt, 1976; Shah, 1998). In order to maintain consistency of methods with the computations ofthe dependent variable, structural equivalence between two actors was computed using Burt’s(1976) Euclidean distance routine in UCINET IV. For each actor, this routine creates arelationship profile by stacking the vector of relationship choices the actor received from otheractors on top of the vector of relationship choices the actor made him or herself. Structuralequivalence is then computed as the Euclidean distance between the profiles of a given pair ofactors.Control VariablesBecause the study examined social influence on role enactment of discretionary (i.e.,non-formal) performance behavior, several variables were included in the analysis to controlformal role behavior. Two variables were developed to model respondents’ formal positions inthe vertical and horizontal organizational structure. Vertically, a variable was created to indicatewhether a pair of actors occupied the same formal position as regular employee or as seniorassociate. Horizontally, a variable was created to indicate whether a given pair of actors wasinterdependent by virtue of the same formal task assignment. For example, employees in two ofthe operator units were responsible for dispatching underground cable repair personnel. Thiswork was divided on the basis of area code, and the control variable indicated whether a givenpair of employees worked on dispatch for the same area code region. Other distinctions weremade on the basis of customers served, long-distance or local telephone service, and worktechnologies employed. In addition, because employment status may affect OCB (Van Dyne &Ang, 1998) a variable was included to distinguish between full-time and contract employees. Forwork unit 7, only vertical position was included as a control variable because there were no taskdivisions and all individuals were employed on a full time basis.Data AnalysisThe data were analyzed at the dyadic level using the quadratic assignment procedure(QAP) regression technique in UCINET 5 (Borgatti et al., 1999). This analysis was a natural and58
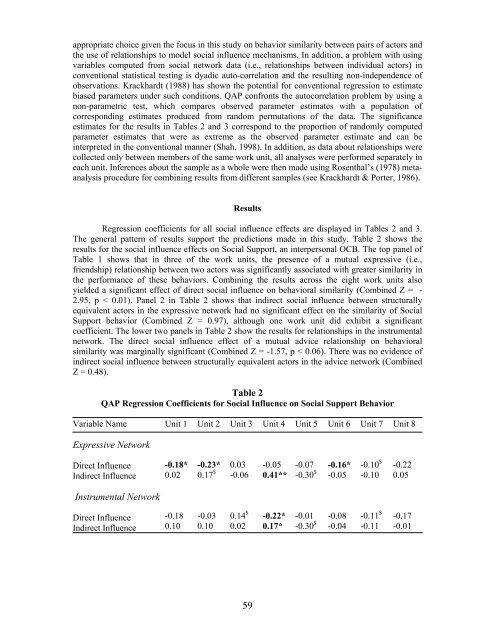
appropriate choice given the focus in this study on behavior similarity between pairs of actors andthe use of relationships to model social influence mechanisms. In addition, a problem with usingvariables computed from social network data (i.e., relationships between individual actors) inconventional statistical testing is dyadic auto-correlation and the resulting non-independence ofobservations. Krackhardt (1988) has shown the potential for conventional regression to estimatebiased parameters under such conditions. QAP confronts the autocorrelation problem by using anon-parametric test, which compares observed parameter estimates with a population ofcorresponding estimates produced from random permutations of the data. The significanceestimates for the results in Tables 2 and 3 correspond to the proportion of randomly computedparameter estimates that were as extreme as the observed parameter estimate and can beinterpreted in the conventional manner (Shah, 1998). In addition, as data about relationships werecollected only between members of the same work unit, all analyses were performed separately ineach unit. Inferences about the sample as a whole were then made using Rosenthal’s (1978) metaanalysisprocedure for combining results from different samples (see Krackhardt & Porter, 1986).ResultsRegression coefficients for all social influence effects are displayed in Tables 2 and 3.The general pattern of results support the predictions made in this study. Table 2 shows theresults for the social influence effects on Social Support, an interpersonal OCB. The top panel ofTable 1 shows that in three of the work units, the presence of a mutual expressive (i.e.,friendship) relationship between two actors was significantly associated with greater similarity inthe performance of these behaviors. Combining the results across the eight work units alsoyielded a significant effect of direct social influence on behavioral similarity (Combined Z = -2.95, p < 0.01). Panel 2 in Table 2 shows that indirect social influence between structurallyequivalent actors in the expressive network had no significant effect on the similarity of SocialSupport behavior (Combined Z = 0.97), although one work unit did exhibit a significantcoefficient. The lower two panels in Table 2 show the results for relationships in the instrumentalnetwork. The direct social influence effect of a mutual advice relationship on behavioralsimilarity was marginally significant (Combined Z = -1.57, p < 0.06). There was no evidence ofindirect social influence between structurally equivalent actors in the advice network (CombinedZ = 0.48).Table 2QAP Regression Coefficients for Social Influence on Social Support BehaviorVariable NameExpressive NetworkDirect InfluenceIndirect InfluenceInstrumental NetworkDirect InfluenceIndirect InfluenceUnit 1-0.18*0.02-0.180.10Unit 2-0.23*0.17 $-0.030.10Unit 30.03-0.060.14 $0.02Unit 4-0.050.41**-0.22*0.17*Unit 5Unit 6-0.07 -0.16*-0.30 $ -0.05-0.01 -0.08-0.30 $ -0.04Unit 7-0.10 $-0.10-0.11 $-0.11Unit 8-0.220.05-0.17-0.0159
- Page 1 and 2:
Volume 24, No. 5, 2003Edited by/Éd
- Page 4 and 5:
Pursey HeugensGreg IrvingRoderick I
- Page 6 and 7:
TABLE OF CONTENTS - TABLE DES MATI
- Page 8 and 9:
study of power displays in mixed-ge
- Page 10 and 11:
on expectations and behaviour (Berg
- Page 12 and 13:
TaskThis study required the use of
- Page 14 and 15: Task-Gender (male-stereotyped or fe
- Page 16 and 17: It is important to understand the s
- Page 18 and 19: Crown, C.L. & Cummins, D.A. (1998).
- Page 20 and 21: Smith-Lovin, L., & Brody, C. (1989)
- Page 22 and 23: Table 2Summary of Descriptive Stati
- Page 24 and 25: Table 4Summary of Interaction of Ge
- Page 26 and 27: ASAC 2003Halifax, Nova ScotiaIain L
- Page 28 and 29: the interrelationships among the MB
- Page 30 and 31: studies (Friedman and Sarros, 1989;
- Page 32 and 33: This study demonstrated that emotio
- Page 34 and 35: Anxiety, Stress and Coping, in pres
- Page 36 and 37: Washington, DC: Taylor and Francis,
- Page 38 and 39: Table 2Overall Goodness-of-Fit Indi
- Page 40 and 41: ζ 3Depersonalizationη 3β 3,1 (+)
- Page 42 and 43: ASAC 2003Halifax, Nova ScotiaWendy
- Page 44 and 45: views independently, gave rise to S
- Page 46 and 47: track assistant, associate, and ful
- Page 48 and 49: ole conflict are positively related
- Page 50 and 51: Table 3. Regression of climate and
- Page 52 and 53: interests.We speculate the null eff
- Page 54 and 55: DOOP and short for DOOP scales,”
- Page 56 and 57: Pelled, L. H., “Demographic diver
- Page 58 and 59: esulting increase in discretion ove
- Page 60 and 61: al., 1995). However, the distinctio
- Page 62 and 63: ise to strong pressures for conform
- Page 66 and 67: Table 3QAP Regression Coefficients
- Page 68 and 69: ConclusionResearchers of social inf
- Page 70 and 71: suggestions for further research.
- Page 72 and 73: performing on the job.” Presumabl
- Page 74 and 75: positively related to performance i
- Page 76 and 77: proposed hypotheses were supported.
- Page 78 and 79: ConclusionThis research has made se
- Page 80 and 81: Be more enthusiastic and exert extr
- Page 82 and 83: Table 2Correlations Among the Laten
- Page 84 and 85: performance expectations on feedbac
- Page 86 and 87: changements qui s’opèrent dans l
- Page 88 and 89: structures, politiques, systèmes,
- Page 90 and 91: comportements liés à la communica
- Page 92 and 93: Tableau 2Échelles de mesure de la
- Page 94 and 95: prédiction des compétences clés
- Page 96 and 97: organisation n’est pas uniforme e
- Page 98 and 99: complètement ce construit. Ces cha
- Page 100 and 101: Wagner, R.K. and Sternberg, R.J. (1
- Page 102 and 103: What is a toxin handler?In two arti
- Page 104 and 105: potentially limited scope and conte
- Page 106 and 107: work role demands. In this survey,
- Page 108 and 109: The three factors in this rotated f
- Page 110 and 111: and service orientation, the abilit
- Page 112 and 113: ASAC 2003Halifax, Nova ScotiaLisa M
- Page 114 and 115:
self-appraisal group reacted more n
- Page 116 and 117:
effect of voice are the value-expre
- Page 118 and 119:
“Strongly Disagree” to “Stron
- Page 120 and 121:
esults suggest that incorporating s
- Page 122 and 123:
Personality and Social Psychology,
- Page 124 and 125:
Table 1Means, Standard Deviations,
- Page 126 and 127:
Table 3Test of the Mediating Role o
- Page 128 and 129:
ASAC 2003Halifax, Nova ScotiaAnn Fr
- Page 130 and 131:
individual level, polychronicity is
- Page 132 and 133:
construct.Drawing on computer-media
- Page 134 and 135:
Consequence: Impact on Work Overloa
- Page 136 and 137:
Conversation complexity may also mo
- Page 138:
Implications for practiceFuture res
- Page 141 and 142:
ReferencesAncona, D.G., Goodman, P.
- Page 143 and 144:
no. 3 (1994): 381-391.Macan, T.H.,
- Page 145 and 146:
ASAC 2003Halifax, Nova ScotiaIan R.
- Page 147 and 148:
Assessing Measures: Affective Commi
- Page 149 and 150:
implications of psychological contr
- Page 151 and 152:
commitment, affective commitment, c
- Page 153 and 154:
Motivational Process Variables. Amo
- Page 155 and 156:
DiscussionThe main purpose of this
- Page 157 and 158:
approaches zero. In the present stu
- Page 159 and 160:
Extension and test of a three-compo
- Page 162 and 163:
Table 1Descriptive Statistics and Z
- Page 164 and 165:
Table 3Standardized Factor Loadings
- Page 166 and 167:
Table 5Hierarchical Regression Anal
- Page 168 and 169:
ASAC 2003Halifax, Nova ScotiaJoan F
- Page 170 and 171:
ASAC 2003Halifax, Nova ScotiaArla D
- Page 172 and 173:
ASAC 2003Halifax, Nova ScotiaIvy Ky
- Page 174:
ASAC 2003Halifax, Nova ScotiaNina D