Women in NSW 2012 - The Workplace Gender Equality Agency
Women in NSW 2012 - The Workplace Gender Equality Agency
Women in NSW 2012 - The Workplace Gender Equality Agency

Create successful ePaper yourself
Turn your PDF publications into a flip-book with our unique Google optimized e-Paper software.
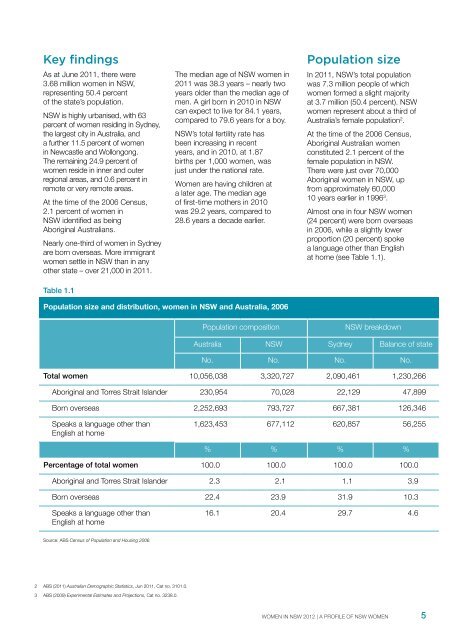
Key f<strong>in</strong>d<strong>in</strong>gsAs at June 2011, there were3.68 million women <strong>in</strong> <strong>NSW</strong>,represent<strong>in</strong>g 50.4 percentof the state’s population.<strong>NSW</strong> is highly urbanised, with 63percent of women resid<strong>in</strong>g <strong>in</strong> Sydney,the largest city <strong>in</strong> Australia, anda further 11.5 percent of women<strong>in</strong> Newcastle and Wollongong.<strong>The</strong> rema<strong>in</strong><strong>in</strong>g 24.9 percent ofwomen reside <strong>in</strong> <strong>in</strong>ner and outerregional areas, and 0.6 percent <strong>in</strong>remote or very remote areas.At the time of the 2006 Census,2.1 percent of women <strong>in</strong><strong>NSW</strong> identified as be<strong>in</strong>gAborig<strong>in</strong>al Australians.Nearly one-third of women <strong>in</strong> Sydneyare born overseas. More immigrantwomen settle <strong>in</strong> <strong>NSW</strong> than <strong>in</strong> anyother state – over 21,000 <strong>in</strong> 2011.Table 1.1<strong>The</strong> median age of <strong>NSW</strong> women <strong>in</strong>2011 was 38.3 years – nearly twoyears older than the median age ofmen. A girl born <strong>in</strong> 2010 <strong>in</strong> <strong>NSW</strong>can expect to live for 84.1 years,compared to 79.6 years for a boy.<strong>NSW</strong>’s total fertility rate hasbeen <strong>in</strong>creas<strong>in</strong>g <strong>in</strong> recentyears, and <strong>in</strong> 2010, at 1.87births per 1,000 women, wasjust under the national rate.<strong>Women</strong> are hav<strong>in</strong>g children ata later age. <strong>The</strong> median ageof first-time mothers <strong>in</strong> 2010was 29.2 years, compared to28.6 years a decade earlier.Population sizeIn 2011, <strong>NSW</strong>’s total populationwas 7.3 million people of whichwomen formed a slight majorityat 3.7 million (50.4 percent). <strong>NSW</strong>women represent about a third ofAustralia’s female population 2 .At the time of the 2006 Census,Aborig<strong>in</strong>al Australian womenconstituted 2.1 percent of thefemale population <strong>in</strong> <strong>NSW</strong>.<strong>The</strong>re were just over 70,000Aborig<strong>in</strong>al women <strong>in</strong> <strong>NSW</strong>, upfrom approximately 60,00010 years earlier <strong>in</strong> 1996 3 .Almost one <strong>in</strong> four <strong>NSW</strong> women(24 percent) were born overseas<strong>in</strong> 2006, while a slightly lowerproportion (20 percent) spokea language other than Englishat home (see Table 1.1).Population size and distribution, women <strong>in</strong> <strong>NSW</strong> and Australia, 2006Population composition<strong>NSW</strong> breakdownAustralia <strong>NSW</strong> Sydney Balance of stateNo. No. No. No.Total women 10,056,038 3,320,727 2,090,461 1,230,266Aborig<strong>in</strong>al and Torres Strait Islander 230,954 70,028 22,129 47,899Born overseas 2,252,693 793,727 667,381 126,346Speaks a language other thanEnglish at home1,623,453 677,112 620,857 56,255% % % %Percentage of total women 100.0 100.0 100.0 100.0Aborig<strong>in</strong>al and Torres Strait Islander 2.3 2.1 1.1 3.9Born overseas 22.4 23.9 31.9 10.3Speaks a language other thanEnglish at home16.1 20.4 29.7 4.6Source: ABS Census of Population and Hous<strong>in</strong>g 2006.2 ABS (2011) Australian Demographic Statistics, Jun 2011, Cat no. 3101.0.3 ABS (2009) Experimental Estimates and Projections, Cat no. 3238.0.WOMEN IN <strong>NSW</strong> <strong>2012</strong> | A PROFILE OF <strong>NSW</strong> WOMEN5