Liv<strong>in</strong>garrangements,marriagesand families<strong>The</strong> majority of families liv<strong>in</strong>g <strong>in</strong> thesame household 10 <strong>in</strong> <strong>NSW</strong> have nodependent children (children agedunder 15 years) (see Table 1.2).<strong>The</strong> percentage of <strong>NSW</strong> familieswith dependent children (36.4percent) is similar to the percentageAustralia-wide (37.0 percent).As people get older, they aremore likely to live alone. Abouta quarter (24.4 percent) ofall people 65 years and over<strong>in</strong> <strong>NSW</strong> were <strong>in</strong> lone personhouseholds <strong>in</strong> 2010 comparedto 9.0 percent of the generalpopulation who lived alone 11 .<strong>The</strong>re are significantly more olderwomen than men liv<strong>in</strong>g alone asshown <strong>in</strong> Figure 1.6. For example,among 80 to 84 year olds, some34,700 women (42 percent ofwomen <strong>in</strong> that age group) live alonecompared to some 11,300 men(just under 20 percent of 80 to84 year old men).Overall, nearly twice the percentageof 65+ women as 65+ men livealone (31.1 percent compared to16.2 percent of men <strong>in</strong> 2006).<strong>The</strong> marriage rate <strong>in</strong> <strong>NSW</strong> hasdecreased slightly <strong>in</strong> the last decadefrom 6.4 per thousand <strong>in</strong> 1999 to5.6 per thousand <strong>in</strong> 2010, as hasthe divorce rate. In 2007, therewere 2.0 divorces per thousand ofpopulation, compared to 2.4 eightyears earlier 12 .Figure 1.6<strong>Women</strong> and men aged 65 years and older who are liv<strong>in</strong>g alone, <strong>NSW</strong>, 2006Age group (yrs)95-9990-9485-8980-8475-7970-7465-690 2 4 6 8 10 12 14 16 18 20 22 24 26 28 30 32 34 36 38 40Number (’000)<strong>Women</strong>MenPopulation: People aged 65 years or older.Source: All data from Census of Population and Hous<strong>in</strong>g 2006, TableBuilder Pro.Figure 1.7<strong>Women</strong> and men lone parent families, <strong>NSW</strong>, 1998 to 2011Percentage (%)22201816141210864201998199920002001200220032004200520062007200820092010<strong>Women</strong> <strong>NSW</strong> Men <strong>NSW</strong> Trend (<strong>Women</strong> <strong>NSW</strong>) Trend (Men <strong>NSW</strong>)Note: <strong>The</strong> figure shows the percentage of lone father and lone mother families with children under 15 years of ageas a proportion of all families with children under 15 years of age.Population: Families with children aged under 15 years liv<strong>in</strong>g <strong>in</strong> the same household.Source: ABS (2011) Australian Social Trends, 1998 to 2011, Cat no. 4102.0.201110 A family is def<strong>in</strong>ed as two or more people related by blood, registered marriage, adoption, or a de facto relationship who live <strong>in</strong> the same household. Families liv<strong>in</strong>g <strong>in</strong> non-private dwell<strong>in</strong>gs andnon-family members (such as friends or boarders) are excluded. Families may be comprised of:• couples with or without resident children of any age,• lone parents with resident children of any age, or• other families of related adults, such as brothers or sisters liv<strong>in</strong>g together, where no couple or parent-child relationship exists.11 ABS (2010) Australian Social Trends, Family and Community data cube, Dec 2010 Cat no. 4102.0.12 ABS (2008) Divorces, Australia, 2007, Cat no. 3307.0.55.001 and previous releases.10 WOMEN IN <strong>NSW</strong> <strong>2012</strong> | A PROFILE OF <strong>NSW</strong> WOMEN
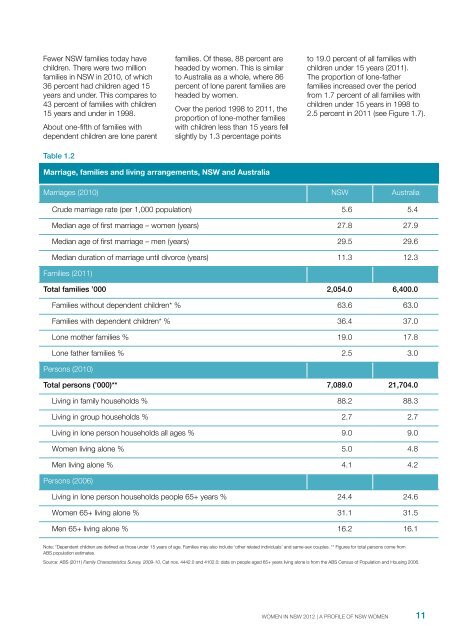
Fewer <strong>NSW</strong> families today havechildren. <strong>The</strong>re were two millionfamilies <strong>in</strong> <strong>NSW</strong> <strong>in</strong> 2010, of which36 percent had children aged 15years and under. This compares to43 percent of families with children15 years and under <strong>in</strong> 1998.About one-fifth of families withdependent children are lone parentTable 1.2families. Of these, 88 percent areheaded by women. This is similarto Australia as a whole, where 86percent of lone parent families areheaded by women.Over the period 1998 to 2011, theproportion of lone-mother familieswith children less than 15 years fellslightly by 1.3 percentage po<strong>in</strong>tsto 19.0 percent of all families withchildren under 15 years (2011).<strong>The</strong> proportion of lone-fatherfamilies <strong>in</strong>creased over the periodfrom 1.7 percent of all families withchildren under 15 years <strong>in</strong> 1998 to2.5 percent <strong>in</strong> 2011 (see Figure 1.7).Marriage, families and liv<strong>in</strong>g arrangements, <strong>NSW</strong> and AustraliaMarriages (2010) <strong>NSW</strong> AustraliaCrude marriage rate (per 1,000 population) 5.6 5.4Median age of first marriage – women (years) 27.8 27.9Median age of first marriage – men (years) 29.5 29.6Median duration of marriage until divorce (years) 11.3 12.3Families (2011)Total families ’000 2,054.0 6,400.0Families without dependent children* % 63.6 63.0Families with dependent children* % 36.4 37.0Lone mother families % 19.0 17.8Lone father families % 2.5 3.0Persons (2010)Total persons (’000)** 7,089.0 21,704.0Liv<strong>in</strong>g <strong>in</strong> family households % 88.2 88.3Liv<strong>in</strong>g <strong>in</strong> group households % 2.7 2.7Liv<strong>in</strong>g <strong>in</strong> lone person households all ages % 9.0 9.0<strong>Women</strong> liv<strong>in</strong>g alone % 5.0 4.8Men liv<strong>in</strong>g alone % 4.1 4.2Persons (2006)Liv<strong>in</strong>g <strong>in</strong> lone person households people 65+ years % 24.4 24.6<strong>Women</strong> 65+ liv<strong>in</strong>g alone % 31.1 31.5Men 65+ liv<strong>in</strong>g alone % 16.2 16.1Note: *Dependent children are def<strong>in</strong>ed as those under 15 years of age. Families may also <strong>in</strong>clude ‘other related <strong>in</strong>dividuals’ and same-sex couples. ** Figures for total persons come fromABS population estimates.Source: ABS (2011) Family Characteristics Survey, 2009-10, Cat nos. 4442.0 and 4102.0; data on people aged 65+ years liv<strong>in</strong>g alone is from the ABS Census of Population and Hous<strong>in</strong>g 2006.WOMEN IN <strong>NSW</strong> <strong>2012</strong> | A PROFILE OF <strong>NSW</strong> WOMEN11