Women in NSW 2012 - The Workplace Gender Equality Agency
Women in NSW 2012 - The Workplace Gender Equality Agency
Women in NSW 2012 - The Workplace Gender Equality Agency

You also want an ePaper? Increase the reach of your titles
YUMPU automatically turns print PDFs into web optimized ePapers that Google loves.
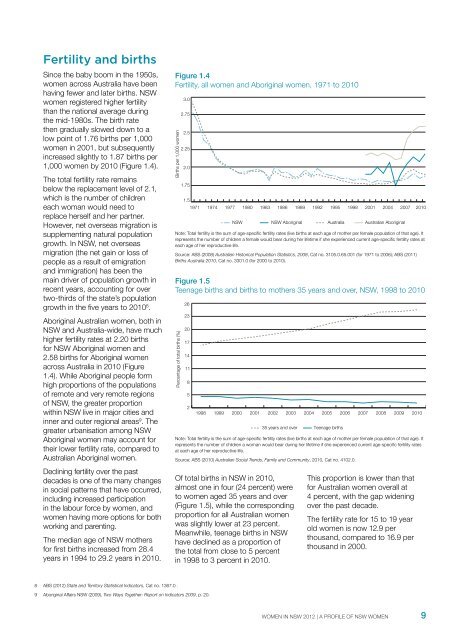
Fertility and birthsS<strong>in</strong>ce the baby boom <strong>in</strong> the 1950s,women across Australia have beenhav<strong>in</strong>g fewer and later births. <strong>NSW</strong>women registered higher fertilitythan the national average dur<strong>in</strong>gthe mid-1980s. <strong>The</strong> birth ratethen gradually slowed down to alow po<strong>in</strong>t of 1.76 births per 1,000women <strong>in</strong> 2001, but subsequently<strong>in</strong>creased slightly to 1.87 births per1,000 women by 2010 (Figure 1.4).<strong>The</strong> total fertility rate rema<strong>in</strong>sbelow the replacement level of 2.1,which is the number of childreneach woman would need toreplace herself and her partner.However, net overseas migration issupplement<strong>in</strong>g natural populationgrowth. In <strong>NSW</strong>, net overseasmigration (the net ga<strong>in</strong> or loss ofpeople as a result of emigrationand immigration) has been thema<strong>in</strong> driver of population growth <strong>in</strong>recent years, account<strong>in</strong>g for overtwo-thirds of the state’s populationgrowth <strong>in</strong> the five years to 2010 8 .Aborig<strong>in</strong>al Australian women, both <strong>in</strong><strong>NSW</strong> and Australia-wide, have muchhigher fertility rates at 2.20 birthsfor <strong>NSW</strong> Aborig<strong>in</strong>al women and2.58 births for Aborig<strong>in</strong>al womenacross Australia <strong>in</strong> 2010 (Figure1.4). While Aborig<strong>in</strong>al people formhigh proportions of the populationsof remote and very remote regionsof <strong>NSW</strong>, the greater proportionwith<strong>in</strong> <strong>NSW</strong> live <strong>in</strong> major cities and<strong>in</strong>ner and outer regional areas 9 . <strong>The</strong>greater urbanisation among <strong>NSW</strong>Aborig<strong>in</strong>al women may account fortheir lower fertility rate, compared toAustralian Aborig<strong>in</strong>al women.Decl<strong>in</strong><strong>in</strong>g fertility over the pastdecades is one of the many changes<strong>in</strong> social patterns that have occurred,<strong>in</strong>clud<strong>in</strong>g <strong>in</strong>creased participation<strong>in</strong> the labour force by women, andwomen hav<strong>in</strong>g more options for bothwork<strong>in</strong>g and parent<strong>in</strong>g.<strong>The</strong> median age of <strong>NSW</strong> mothersfor first births <strong>in</strong>creased from 28.4years <strong>in</strong> 1994 to 29.2 years <strong>in</strong> 2010.Figure 1.4Fertility, all women and Aborig<strong>in</strong>al women, 1971 to 2010Births per 1,000 women3.02.752.52.252.01.751.5197119741977198019831986Of total births <strong>in</strong> <strong>NSW</strong> <strong>in</strong> 2010,almost one <strong>in</strong> four (24 percent) wereto women aged 35 years and over(Figure 1.5), while the correspond<strong>in</strong>gproportion for all Australian womenwas slightly lower at 23 percent.Meanwhile, teenage births <strong>in</strong> <strong>NSW</strong>have decl<strong>in</strong>ed as a proportion ofthe total from close to 5 percent<strong>in</strong> 1998 to 3 percent <strong>in</strong> 2010.198919921995199820012004<strong>NSW</strong> <strong>NSW</strong> Aborig<strong>in</strong>al Australia Australian Aborig<strong>in</strong>alNote: Total fertility is the sum of age-specific fertility rates (live births at each age of mother per female population of that age). Itrepresents the number of children a female would bear dur<strong>in</strong>g her lifetime if she experienced current age-specific fertility rates ateach age of her reproductive life.Source: ABS (2008) Australian Historical Population Statistics, 2008, Cat no. 3105.0.65.001 (for 1971 to 2006); ABS (2011)Births Australia 2010, Cat no. 3301.0 (for 2000 to 2010).Figure 1.5Teenage births and births to mothers 35 years and over, <strong>NSW</strong>, 1998 to 2010Percentage of total births (%)2623201714118521998199920002001200220032004200535 years and over Teenage birthsNote: Total fertility is the sum of age-specific fertility rates (live births at each age of mother per female population of that age). Itrepresents the number of children a woman would bear dur<strong>in</strong>g her lifetime if she experienced current age-specific fertility ratesat each age of her reproductive life.Source: ABS (2010) Australian Social Trends, Family and Community, 2010, Cat no. 4102.0.20062007200820092007This proportion is lower than thatfor Australian women overall at4 percent, with the gap widen<strong>in</strong>gover the past decade.<strong>The</strong> fertility rate for 15 to 19 yearold women is now 12.9 perthousand, compared to 16.9 perthousand <strong>in</strong> 2000.201020108 ABS (<strong>2012</strong>) State and Territory Statistical Indicators, Cat no. 1367.0 .9 Aborig<strong>in</strong>al Affairs <strong>NSW</strong> (2009), Two Ways Together: Report on Indicators 2009, p. 20.WOMEN IN <strong>NSW</strong> <strong>2012</strong> | A PROFILE OF <strong>NSW</strong> WOMEN9