Women in NSW 2012 - The Workplace Gender Equality Agency
Women in NSW 2012 - The Workplace Gender Equality Agency
Women in NSW 2012 - The Workplace Gender Equality Agency

You also want an ePaper? Increase the reach of your titles
YUMPU automatically turns print PDFs into web optimized ePapers that Google loves.
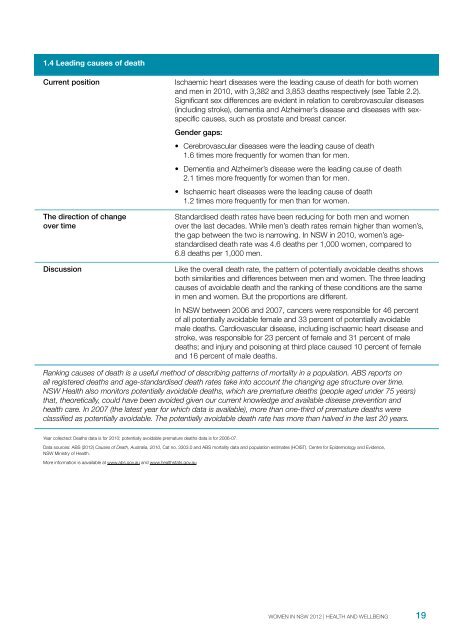
1.4 Lead<strong>in</strong>g causes of deathCurrent position<strong>The</strong> direction of changeover timeDiscussionIschaemic heart diseases were the lead<strong>in</strong>g cause of death for both womenand men <strong>in</strong> 2010, with 3,382 and 3,853 deaths respectively (see Table 2.2).Significant sex differences are evident <strong>in</strong> relation to cerebrovascular diseases(<strong>in</strong>clud<strong>in</strong>g stroke), dementia and Alzheimer’s disease and diseases with sexspecificcauses, such as prostate and breast cancer.<strong>Gender</strong> gaps:• Cerebrovascular diseases were the lead<strong>in</strong>g cause of death1.6 times more frequently for women than for men.• Dementia and Alzheimer’s disease were the lead<strong>in</strong>g cause of death2.1 times more frequently for women than for men.• Ischaemic heart diseases were the lead<strong>in</strong>g cause of death1.2 times more frequently for men than for women.Standardised death rates have been reduc<strong>in</strong>g for both men and womenover the last decades. While men’s death rates rema<strong>in</strong> higher than women’s,the gap between the two is narrow<strong>in</strong>g. In <strong>NSW</strong> <strong>in</strong> 2010, women’s agestandardiseddeath rate was 4.6 deaths per 1,000 women, compared to6.8 deaths per 1,000 men.Like the overall death rate, the pattern of potentially avoidable deaths showsboth similarities and differences between men and women. <strong>The</strong> three lead<strong>in</strong>gcauses of avoidable death and the rank<strong>in</strong>g of these conditions are the same<strong>in</strong> men and women. But the proportions are different.In <strong>NSW</strong> between 2006 and 2007, cancers were responsible for 46 percentof all potentially avoidable female and 33 percent of potentially avoidablemale deaths. Cardiovascular disease, <strong>in</strong>clud<strong>in</strong>g ischaemic heart disease andstroke, was responsible for 23 percent of female and 31 percent of maledeaths; and <strong>in</strong>jury and poison<strong>in</strong>g at third place caused 10 percent of femaleand 16 percent of male deaths.Rank<strong>in</strong>g causes of death is a useful method of describ<strong>in</strong>g patterns of mortality <strong>in</strong> a population. ABS reports onall registered deaths and age-standardised death rates take <strong>in</strong>to account the chang<strong>in</strong>g age structure over time.<strong>NSW</strong> Health also monitors potentially avoidable deaths, which are premature deaths (people aged under 75 years)that, theoretically, could have been avoided given our current knowledge and available disease prevention andhealth care. In 2007 (the latest year for which data is available), more than one-third of premature deaths wereclassified as potentially avoidable. <strong>The</strong> potentially avoidable death rate has more than halved <strong>in</strong> the last 20 years.Year collected: Deaths data is for 2010; potentially avoidable premature deaths data is for 2006-07.Data sources: ABS (<strong>2012</strong>) Causes of Death, Australia, 2010, Cat no. 3303.0 and ABS mortality data and population estimates (HOIST). Centre for Epidemiology and Evidence,<strong>NSW</strong> M<strong>in</strong>istry of Health.More <strong>in</strong>formation is aavailable at www.abs.gov.au and www.healthstats.gov.auWOMEN IN <strong>NSW</strong> <strong>2012</strong> | HEALTH AND WELLBEING19