Women in NSW 2012 - The Workplace Gender Equality Agency
Women in NSW 2012 - The Workplace Gender Equality Agency
Women in NSW 2012 - The Workplace Gender Equality Agency

You also want an ePaper? Increase the reach of your titles
YUMPU automatically turns print PDFs into web optimized ePapers that Google loves.
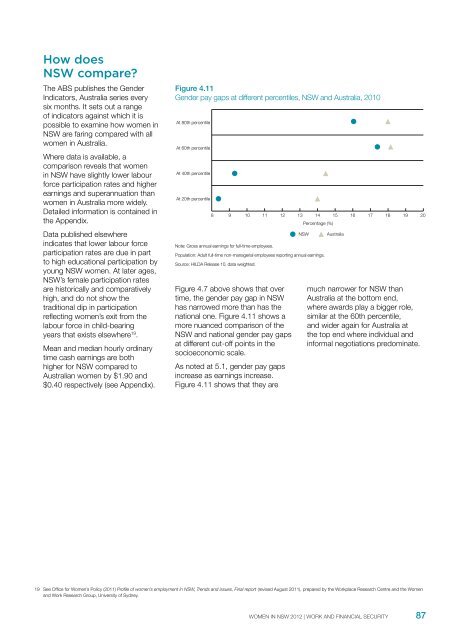
How does<strong>NSW</strong> compare?<strong>The</strong> ABS publishes the <strong>Gender</strong>Indicators, Australia series everysix months. It sets out a rangeof <strong>in</strong>dicators aga<strong>in</strong>st which it ispossible to exam<strong>in</strong>e how women <strong>in</strong><strong>NSW</strong> are far<strong>in</strong>g compared with allwomen <strong>in</strong> Australia.Where data is available, acomparison reveals that women<strong>in</strong> <strong>NSW</strong> have slightly lower labourforce participation rates and higherearn<strong>in</strong>gs and superannuation thanwomen <strong>in</strong> Australia more widely.Detailed <strong>in</strong>formation is conta<strong>in</strong>ed <strong>in</strong>the Appendix.Data published elsewhere<strong>in</strong>dicates that lower labour forceparticipation rates are due <strong>in</strong> partto high educational participation byyoung <strong>NSW</strong> women. At later ages,<strong>NSW</strong>’s female participation ratesare historically and comparativelyhigh, and do not show thetraditional dip <strong>in</strong> participationreflect<strong>in</strong>g women’s exit from thelabour force <strong>in</strong> child-bear<strong>in</strong>gyears that exists elsewhere 19 .Mean and median hourly ord<strong>in</strong>arytime cash earn<strong>in</strong>gs are bothhigher for <strong>NSW</strong> compared toAustralian women by $1.90 and$0.40 respectively (see Appendix).Figure 4.11<strong>Gender</strong> pay gaps at different percentiles, <strong>NSW</strong> and Australia, 2010At 80th percentileAt 60th percentileAt 40th percentileAt 20th percentile8 9 10 11 12 13 14 15 16 17 18 19 20Note: Gross annual earn<strong>in</strong>gs for full-time employees.Figure 4.7 above shows that overtime, the gender pay gap <strong>in</strong> <strong>NSW</strong>has narrowed more than has thenational one. Figure 4.11 shows amore nuanced comparison of the<strong>NSW</strong> and national gender pay gapsat different cut-off po<strong>in</strong>ts <strong>in</strong> thesocioeconomic scale.As noted at 5.1, gender pay gaps<strong>in</strong>crease as earn<strong>in</strong>gs <strong>in</strong>crease.Figure 4.11 shows that they arePercentage (%)<strong>NSW</strong>Population: Adult full-time non-managerial employees report<strong>in</strong>g annual earn<strong>in</strong>gs.Source: HILDA Release 10, data weighted.Australiamuch narrower for <strong>NSW</strong> thanAustralia at the bottom end,where awards play a bigger role,similar at the 60th percentile,and wider aga<strong>in</strong> for Australia atthe top end where <strong>in</strong>dividual and<strong>in</strong>formal negotiations predom<strong>in</strong>ate.19 See Office for <strong>Women</strong>’s Policy (2011) Profile of women’s employment <strong>in</strong> <strong>NSW</strong>, Trends and issues, F<strong>in</strong>al report (revised August 2011), prepared by the <strong>Workplace</strong> Research Centre and the <strong>Women</strong>and Work Research Group, University of Sydney.WOMEN IN <strong>NSW</strong> <strong>2012</strong> | WORK AND FINANCIAL SECURITY87