Women in NSW 2012 - The Workplace Gender Equality Agency
Women in NSW 2012 - The Workplace Gender Equality Agency
Women in NSW 2012 - The Workplace Gender Equality Agency

Create successful ePaper yourself
Turn your PDF publications into a flip-book with our unique Google optimized e-Paper software.
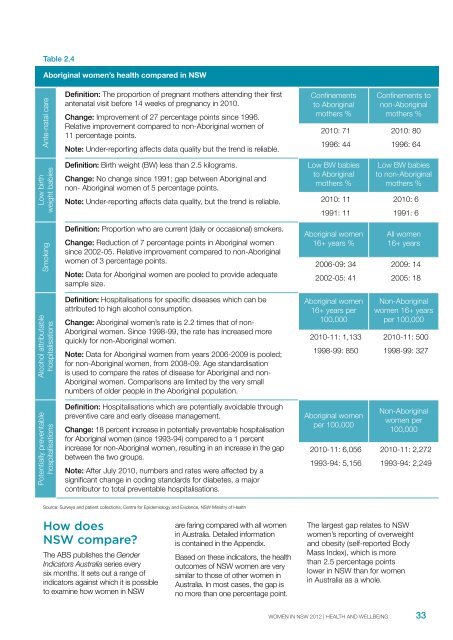
Table 2.4Aborig<strong>in</strong>al women’s health compared <strong>in</strong> <strong>NSW</strong>Ante-natal careDef<strong>in</strong>ition: <strong>The</strong> proportion of pregnant mothers attend<strong>in</strong>g their firstantenatal visit before 14 weeks of pregnancy <strong>in</strong> 2010.Change: Improvement of 27 percentage po<strong>in</strong>ts s<strong>in</strong>ce 1996.Relative improvement compared to non-Aborig<strong>in</strong>al women of11 percentage po<strong>in</strong>ts.Note: Under-report<strong>in</strong>g affects data quality but the trend is reliable.Conf<strong>in</strong>ementsto Aborig<strong>in</strong>almothers %2010: 711996: 44Conf<strong>in</strong>ements tonon-Aborig<strong>in</strong>almothers %2010: 801996: 64Low birthweight babiesDef<strong>in</strong>ition: Birth weight (BW) less than 2.5 kilograms.Low BW babies Low BW babiesto Aborig<strong>in</strong>al to non-Aborig<strong>in</strong>alChange: No change s<strong>in</strong>ce 1991; gap between Aborig<strong>in</strong>al andmothers % mothers %non- Aborig<strong>in</strong>al women of 5 percentage po<strong>in</strong>ts.Note: Under-report<strong>in</strong>g affects data quality, but the trend is reliable. 2010: 11 2010: 61991: 11 1991: 6Smok<strong>in</strong>gDef<strong>in</strong>ition: Proportion who are current (daily or occasional) smokers.Change: Reduction of 7 percentage po<strong>in</strong>ts <strong>in</strong> Aborig<strong>in</strong>al womens<strong>in</strong>ce 2002-05. Relative improvement compared to non-Aborig<strong>in</strong>alwomen of 3 percentage po<strong>in</strong>ts.Note: Data for Aborig<strong>in</strong>al women are pooled to provide adequatesample size.Aborig<strong>in</strong>al women16+ years %2006-09: 34All women16+ years2009: 142002-05: 41 2005: 18Alcohol attributablehospitalisationsDef<strong>in</strong>ition: Hospitalisations for specific diseases which can beattributed to high alcohol consumption.Change: Aborig<strong>in</strong>al women’s rate is 2.2 times that of non-Aborig<strong>in</strong>al women. S<strong>in</strong>ce 1998-99, the rate has <strong>in</strong>creased morequickly for non-Aborig<strong>in</strong>al women.Note: Data for Aborig<strong>in</strong>al women from years 2006-2009 is pooled;for non-Aborig<strong>in</strong>al women, from 2008-09. Age standardisationis used to compare the rates of disease for Aborig<strong>in</strong>al and non-Aborig<strong>in</strong>al women. Comparisons are limited by the very smallnumbers of older people <strong>in</strong> the Aborig<strong>in</strong>al population.Aborig<strong>in</strong>al women16+ years per100,0002010-11: 1,1331998-99: 850Non-Aborig<strong>in</strong>alwomen 16+ yearsper 100,0002010-11: 5001998-99: 327Potentially preventablehospitalisationsDef<strong>in</strong>ition: Hospitalisations which are potentially avoidable throughpreventive care and early disease management.Change: 18 percent <strong>in</strong>crease <strong>in</strong> potentially preventable hospitalisationfor Aborig<strong>in</strong>al women (s<strong>in</strong>ce 1993-94) compared to a 1 percent<strong>in</strong>crease for non-Aborig<strong>in</strong>al women, result<strong>in</strong>g <strong>in</strong> an <strong>in</strong>crease <strong>in</strong> the gapbetween the two groups.Note: After July 2010, numbers and rates were affected by asignificant change <strong>in</strong> cod<strong>in</strong>g standards for diabetes, a majorcontributor to total preventable hospitalisations.Aborig<strong>in</strong>al womenper 100,0002010-11: 6,0561993-94: 5,156Non-Aborig<strong>in</strong>alwomen per100,0002010-11: 2,2721993-94: 2,249Source: Surveys and patient collections, Centre for Epidemiology and Evidence, <strong>NSW</strong> M<strong>in</strong>istry of HealthHow does<strong>NSW</strong> compare?<strong>The</strong> ABS publishes the <strong>Gender</strong>Indicators Australia series everysix months. It sets out a range of<strong>in</strong>dicators aga<strong>in</strong>st which it is possibleto exam<strong>in</strong>e how women <strong>in</strong> <strong>NSW</strong>are far<strong>in</strong>g compared with all women<strong>in</strong> Australia. Detailed <strong>in</strong>formationis conta<strong>in</strong>ed <strong>in</strong> the Appendix.Based on these <strong>in</strong>dicators, the healthoutcomes of <strong>NSW</strong> women are verysimilar to those of other women <strong>in</strong>Australia. In most cases, the gap isno more than one percentage po<strong>in</strong>t.<strong>The</strong> largest gap relates to <strong>NSW</strong>women’s report<strong>in</strong>g of overweightand obesity (self-reported BodyMass Index), which is morethan 2.5 percentage po<strong>in</strong>tslower <strong>in</strong> <strong>NSW</strong> than for women<strong>in</strong> Australia as a whole.WOMEN IN <strong>NSW</strong> <strong>2012</strong> | HEALTH AND WELLBEING33