- Page 1 and 2: IOI CORPORATION BERHAD (9027-W)IOI
- Page 3 and 4: KEYINDICATORS20%15105IOI CORPORATIO
- Page 5 and 6: OUR VISIONOUR COREVALUESCONTENTSIOI
- Page 7 and 8: CHAIRMAN’SSTATEMENT
- Page 9 and 10: CONTRIBUTION TO SEGMENT RESULTS2012
- Page 11 and 12: Sustainability andCORPORATE SOCIALR
- Page 13 and 14: GROUP FINANCIALOVERVIEWCASH FLOWFOR
- Page 15 and 16: GROUP PERFORMANCEHIGHLIGHTS2012RM
- Page 17 and 18: FIVE-YEAR FINANCIALHIGHLIGHTS2012RM
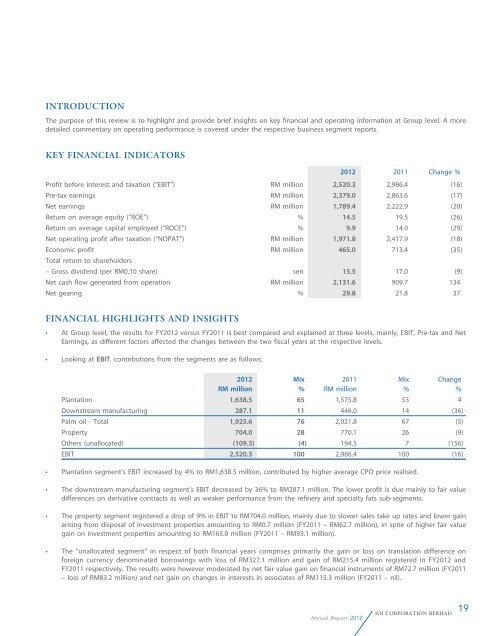
- Page 19: MANAGEMENT’SDISCUSSION AND ANALYS
- Page 23 and 24: 20181614121086420-2%Cost of Equity
- Page 25 and 26: plantationAchievements in productiv
- Page 27 and 28: PLANTATION
- Page 29 and 30: PLANTATION STATISTICSCROP STATEMENT
- Page 31 and 32: OPERATIONS REVIEWFor the financial
- Page 33 and 34: esource-based manufacturingThe succ
- Page 35 and 36: RESOURCE-BASED MANUFACTURING
- Page 37 and 38: OLEOCHEMICALSMANUFACTURINGThe princ
- Page 39 and 40: Bottom: IOI Loders CroklaanAmericas
- Page 41 and 42: PROPERTYA green building comprises
- Page 43 and 44: Property
- Page 45 and 46: Left: The new Palm GardenGolf Cours
- Page 47 and 48: OUTLOOK & PROSPECTSThe local proper
- Page 49 and 50: sustainability andCORPORATE SOCIAL
- Page 51 and 52: Top: Beneficial plants.Bottom: Buff
- Page 53 and 54: Operating under the Institute of Sh
- Page 55 and 56: CORPORATE SOCIALRESPONSIBILITYSocia
- Page 57 and 58: SEPTEMBER 2011Palm Garden Hotel, to
- Page 59 and 60: DECEMBER 2011IOI Mall Puchong offer
- Page 61 and 62: APRIL 2012Yayasan TSLSC donated RM2
- Page 63 and 64: BOARD OF DIRECTORS3 4211. DATO’ L
- Page 65 and 66: PROFILE OFDIRECTORSWhen others seet
- Page 67 and 68: Lee Cheng Leang was first appointed
- Page 69 and 70: Quah Poh Keat was first appointed t
- Page 71 and 72:
SeniorManagement TeamGroup Chief Ex
- Page 73 and 74:
GLOBALPRESENCECANADAONTARIOCANADAON
- Page 75 and 76:
LOCATION OFOPERATIONS IN MALAYSIAPe
- Page 77 and 78:
CORPORATECALENDARJULY 2011IOI Corpo
- Page 79 and 80:
JANUARY 2012IOIP, through its subsi
- Page 81 and 82:
MAY 2012IOI Oleochemical’s Penang
- Page 83 and 84:
Audit and Risk ManagementCommittee
- Page 85 and 86:
x. To review any related party tran
- Page 87 and 88:
STATEMENT ONCORPORATE GOVERNANCEInt
- Page 89 and 90:
Training and Development of Directo
- Page 91 and 92:
Cheah Tek Kuang 2011 Forbes Global
- Page 93 and 94:
SHAREHOLDERSDialogue Between the Co
- Page 95 and 96:
STATEMENT ONINTERNAL CONTROLINTRODU
- Page 97 and 98:
MONITORING• The Group’s policie
- Page 99 and 100:
STATEMENT OF DIRECTORS’ INTERESTS
- Page 101 and 102:
Notes:(1) Details of the transactin
- Page 103 and 104:
DIRECTORS’REPORTThe Directors of
- Page 105 and 106:
DIRECTORS’REPORTUSD600 Million Ze
- Page 107 and 108:
DIRECTORS’REPORTExecutive Share O
- Page 109 and 110:
DIRECTORS’REPORTDirectors’ Inte
- Page 111 and 112:
DIRECTORS’REPORTSignificant Event
- Page 113 and 114:
INCOMESTATEMENTSFor The Financial Y
- Page 115 and 116:
STATEMENTS OFFINANCIAL POSITIONAs A
- Page 117 and 118:
STATEMENTS OFCHANGES IN EQUITYFor T
- Page 119 and 120:
STATEMENTS OFCHANGES IN EQUITYFor T
- Page 121 and 122:
STATEMENTS OFCASH FLOWSFor The Fina
- Page 123 and 124:
STATEMENTS OFCASH FLOWSFor The Fina
- Page 125 and 126:
NOTES TO THEFINANCIAL STATEMENTS3.
- Page 127 and 128:
NOTES TO THEFINANCIAL STATEMENTS3.
- Page 129 and 130:
NOTES TO THEFINANCIAL STATEMENTS3.
- Page 131 and 132:
NOTES TO THEFINANCIAL STATEMENTS4.
- Page 133 and 134:
NOTES TO THEFINANCIAL STATEMENTS5.
- Page 135 and 136:
NOTES TO THEFINANCIAL STATEMENTS5.
- Page 137 and 138:
NOTES TO THEFINANCIAL STATEMENTS5.
- Page 139 and 140:
NOTES TO THEFINANCIAL STATEMENTS5.
- Page 141 and 142:
NOTES TO THEFINANCIAL STATEMENTS5.
- Page 143 and 144:
NOTES TO THEFINANCIAL STATEMENTS5.
- Page 145 and 146:
NOTES TO THEFINANCIAL STATEMENTS5.
- Page 147 and 148:
NOTES TO THEFINANCIAL STATEMENTS5.
- Page 149 and 150:
NOTES TO THEFINANCIAL STATEMENTS5.
- Page 151 and 152:
NOTES TO THEFINANCIAL STATEMENTS5.
- Page 153 and 154:
NOTES TO THEFINANCIAL STATEMENTS5.
- Page 155 and 156:
NOTES TO THEFINANCIAL STATEMENTS5.
- Page 157 and 158:
NOTES TO THEFINANCIAL STATEMENTS7.
- Page 159 and 160:
NOTES TO THEFINANCIAL STATEMENTS8.
- Page 161 and 162:
NOTES TO THEFINANCIAL STATEMENTS11.
- Page 163 and 164:
NOTES TO THEFINANCIAL STATEMENTS13.
- Page 165 and 166:
NOTES TO THEFINANCIAL STATEMENTS14.
- Page 167 and 168:
NOTES TO THEFINANCIAL STATEMENTS14.
- Page 169 and 170:
NOTES TO THEFINANCIAL STATEMENTS15.
- Page 171 and 172:
NOTES TO THEFINANCIAL STATEMENTS17.
- Page 173 and 174:
NOTES TO THEFINANCIAL STATEMENTS17.
- Page 175 and 176:
NOTES TO THEFINANCIAL STATEMENTS18.
- Page 177 and 178:
NOTES TO THEFINANCIAL STATEMENTS19.
- Page 179 and 180:
NOTES TO THEFINANCIAL STATEMENTS21.
- Page 181 and 182:
NOTES TO THEFINANCIAL STATEMENTS22.
- Page 183 and 184:
NOTES TO THEFINANCIAL STATEMENTS23.
- Page 185 and 186:
NOTES TO THEFINANCIAL STATEMENTS25.
- Page 187 and 188:
NOTES TO THEFINANCIAL STATEMENTS26.
- Page 189 and 190:
NOTES TO THEFINANCIAL STATEMENTS31.
- Page 191 and 192:
NOTES TO THEFINANCIAL STATEMENTS31.
- Page 193 and 194:
NOTES TO THEFINANCIAL STATEMENTS31.
- Page 195 and 196:
NOTES TO THEFINANCIAL STATEMENTS32.
- Page 197 and 198:
NOTES TO THEFINANCIAL STATEMENTS34.
- Page 199 and 200:
NOTES TO THEFINANCIAL STATEMENTS34.
- Page 201 and 202:
NOTES TO THEFINANCIAL STATEMENTS34.
- Page 203 and 204:
NOTES TO THEFINANCIAL STATEMENTS34.
- Page 205 and 206:
NOTES TO THEFINANCIAL STATEMENTS35.
- Page 207 and 208:
NOTES TO THEFINANCIAL STATEMENTS36.
- Page 209 and 210:
NOTES TO THEFINANCIAL STATEMENTS37.
- Page 211 and 212:
NOTES TO THEFINANCIAL STATEMENTS39.
- Page 213 and 214:
NOTES TO THEFINANCIAL STATEMENTS40.
- Page 215 and 216:
NOTES TO THEFINANCIAL STATEMENTS42.
- Page 217 and 218:
NOTES TO THEFINANCIAL STATEMENTS42.
- Page 219 and 220:
NOTES TO THEFINANCIAL STATEMENTS42.
- Page 221 and 222:
NOTES TO THEFINANCIAL STATEMENTS42.
- Page 223 and 224:
NOTES TO THEFINANCIAL STATEMENTS42.
- Page 225 and 226:
NOTES TO THEFINANCIAL STATEMENTS42.
- Page 227 and 228:
NOTES TO THEFINANCIAL STATEMENTS42.
- Page 229 and 230:
NOTES TO THEFINANCIAL STATEMENTS42.
- Page 231 and 232:
NOTES TO THEFINANCIAL STATEMENTS42.
- Page 233 and 234:
NOTES TO THEFINANCIAL STATEMENTS42.
- Page 235 and 236:
NOTES TO THEFINANCIAL STATEMENTS42.
- Page 237 and 238:
NOTES TO THEFINANCIAL STATEMENTS42.
- Page 239 and 240:
NOTES TO THEFINANCIAL STATEMENTS42.
- Page 241 and 242:
NOTES TO THEFINANCIAL STATEMENTS42.
- Page 243 and 244:
NOTES TO THEFINANCIAL STATEMENTS42.
- Page 245 and 246:
NOTES TO THEFINANCIAL STATEMENTS42.
- Page 247 and 248:
NOTES TO THEFINANCIAL STATEMENTS42.
- Page 249 and 250:
NOTES TO THEFINANCIAL STATEMENTS43.
- Page 251 and 252:
NOTES TO THEFINANCIAL STATEMENTS45.
- Page 253 and 254:
NOTES TO THEFINANCIAL STATEMENTS45.
- Page 255 and 256:
NOTES TO THEFINANCIAL STATEMENTS45.
- Page 257 and 258:
NOTES TO THEFINANCIAL STATEMENTS46.
- Page 259 and 260:
NOTES TO THEFINANCIAL STATEMENTS46.
- Page 261 and 262:
NOTES TO THEFINANCIAL STATEMENTS46.
- Page 263 and 264:
NOTES TO THEFINANCIAL STATEMENTS46.
- Page 265 and 266:
NOTES TO THEFINANCIAL STATEMENTS46.
- Page 267 and 268:
NOTES TO THEFINANCIAL STATEMENTS46.
- Page 269 and 270:
NOTES TO THEFINANCIAL STATEMENTS48.
- Page 271 and 272:
INDEPENDENTAUDITORS’ REPORTTo The
- Page 273 and 274:
GROUPPROPERTIESA. PLANTATIONS ESTAT
- Page 275 and 276:
GROUPPROPERTIESB. DEVELOPMENT PROPE
- Page 277 and 278:
GROUPPROPERTIESB. DEVELOPMENT PROPE
- Page 279 and 280:
GROUPPROPERTIESC. INVESTMENT PROPER
- Page 281 and 282:
GROUPPROPERTIESD. INDUSTRIAL PROPER
- Page 283 and 284:
GROUPPROPERTIESE. OTHER PROPERTIES
- Page 285 and 286:
NOTICE ofAnnual general MeetingAGEN
- Page 287 and 288:
NOTICE ofAnnual general MeetingNote
- Page 289 and 290:
SHAREHOLDERSINFORMATIONAs At 30 Aug
- Page 291 and 292:
SHAREHOLDERSINFORMATIONAs At 30 Aug
- Page 293:
1st fold heresTAMPThe Company Secre