- Page 1: ANNUAL REPORT 2009-10ANNUAL REPORT2
- Page 4 and 5: ANNUAL REPORT 2009-10PART IIISTATUT
- Page 6 and 7: ANNUAL REPORT 2009-1027. Net Incurr
- Page 8 and 9: ANNUAL REPORT 2009-1046. Underwriti
- Page 10 and 11: ANNUAL REPORT 2009-10TEAM AT IRDAJ.
- Page 12 and 13: ANNUAL REPORT 2009-10Prabodh Chande
- Page 14 and 15: ANNUAL REPORT 2009-10NAMEMahesh Aga
- Page 16 and 17: ANNUAL REPORT 2009-10Randip Singh J
- Page 18 and 19: ANNUAL REPORT 2009-10in financial s
- Page 20 and 21: ANNUAL REPORT 2009-10during the yea
- Page 22 and 23: ANNUAL REPORT 2009-10Corporate Gove
- Page 24 and 25: ANNUAL REPORT 2009-108
- Page 26 and 27: ANNUAL REPORT 2009-10during 2009-10
- Page 30 and 31: ANNUAL REPORT 2009-103. APPRAISAL O
- Page 32 and 33: ANNUAL REPORT 2009-10Market ShareI.
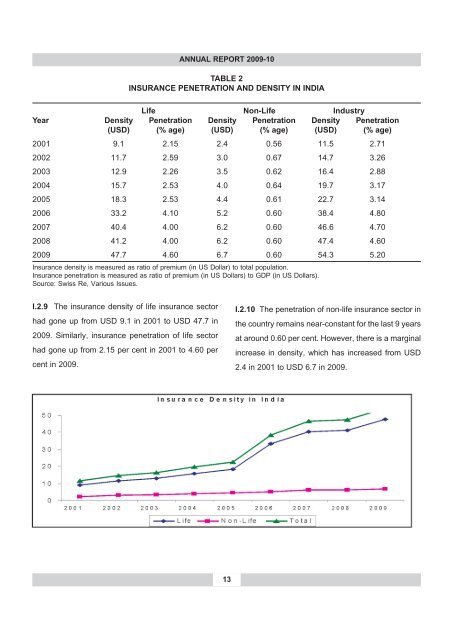
- Page 34 and 35: ANNUAL REPORT 2009-10I.3.16 The ope
- Page 36 and 37: that companies in the life sector t
- Page 38 and 39: ANNUAL REPORT 2009-10department, un
- Page 40 and 41: ANNUAL REPORT 2009-10declined in ca
- Page 42 and 43: ANNUAL REPORT 2009-10TABLE 23PAID U
- Page 44 and 45: ANNUAL REPORT 2009-10TABLE 28INCURR
- Page 46 and 47: ANNUAL REPORT 2009-10Star Health an
- Page 48 and 49: ANNUAL REPORT 2009-10prevailing as
- Page 50 and 51: ANNUAL REPORT 2009-104.2 MAINTENANC
- Page 52 and 53: ANNUAL REPORT 2009-10I.4.3.3 The Re
- Page 54 and 55: ANNUAL REPORT 2009-10I.4.4.1 During
- Page 56 and 57: ANNUAL REPORT 2009-10TABLE 38DEVELO
- Page 58 and 59: I.4.5.5 Based on a further segregat
- Page 60 and 61: ANNUAL REPORT 2009-10I.4.6.5 The re
- Page 62 and 63: ANNUAL REPORT 2009-10In the days to
- Page 64 and 65: ANNUAL REPORT 2009-10I.4.6.13 The A
- Page 66 and 67: ANNUAL REPORT 2009-10into account w
- Page 68 and 69: ANNUAL REPORT 2009-10actually make
- Page 70 and 71: ANNUAL REPORT 2009-10was a quantum
- Page 72 and 73: ANNUAL REPORT 2009-10TABLE 51GROUP
- Page 74 and 75: ANNUAL REPORT 2009-1058
- Page 76 and 77: ANNUAL REPORT 2009-10II.2.2 The tur
- Page 78 and 79:
ANNUAL REPORT 2009-10TABLE 58GROUP
- Page 80 and 81:
ANNUAL REPORT 2009-10II.2.12 During
- Page 82 and 83:
ANNUAL REPORT 2009-10Since no relie
- Page 84 and 85:
ANNUAL REPORT 2009-10II.5.2 During
- Page 86 and 87:
ANNUAL REPORT 2009-10TABLE 69STATUS
- Page 88 and 89:
ANNUAL REPORT 2009-10GENERAL INSURA
- Page 90 and 91:
ANNUAL REPORT 2009-10• Disseminat
- Page 92 and 93:
ANNUAL REPORT 2009-102. Protection
- Page 94 and 95:
ANNUAL REPORT 2009-107. Levying fee
- Page 96 and 97:
ANNUAL REPORT 2009-10III.11.4 Also,
- Page 98 and 99:
ANNUAL REPORT 2009-10(b)Social Sect
- Page 100 and 101:
ANNUAL REPORT 2009-10issues on the
- Page 102 and 103:
ANNUAL REPORT 2009-10IV.6.13 The pr
- Page 104 and 105:
ANNUAL REPORT 2009-1088
- Page 106 and 107:
ANNUAL REPORT 2009-10INTERNATIONAL
- Page 108 and 109:
ANNUAL REPORT 2009-10TOTAL LIFE INS
- Page 110 and 111:
ANNUAL REPORT 2009-10INDIVIDUAL NEW
- Page 112 and 113:
ANNUAL REPORT 2009-10GROUP NEW BUSI
- Page 114 and 115:
ANNUAL REPORT 2009-10STATE WISE IND
- Page 116 and 117:
ANNUAL REPORT 2009-10INDIVIDUAL BUS
- Page 118 and 119:
ANNUAL REPORT 2009-10LINKED AND NON
- Page 120 and 121:
ANNUAL REPORT 2009-10LINKED AND NON
- Page 122 and 123:
ANNUAL REPORT 2009-10INDIVIDUAL DEA
- Page 124 and 125:
ANNUAL REPORT 2009-10GROUP DEATH CL
- Page 126 and 127:
ANNUAL REPORT 2009-10DURATION WISE
- Page 128 and 129:
ANNUAL REPORT 2009-10ASSETS UNDER M
- Page 130 and 131:
ANNUAL REPORT 2009-10EQUITY SHARE C
- Page 132 and 133:
ANNUAL REPORT 2009-10LIFE INSURERS
- Page 134 and 135:
ANNUAL REPORT 2009-10LIFE INSURERS
- Page 136 and 137:
ANNUAL REPORT 2009-10LIFE INSURERS
- Page 138 and 139:
ANNUAL REPORT 2009-10LIFE INSURERS
- Page 140 and 141:
ANNUAL REPORT 2009-10LIFE INSURERS
- Page 142 and 143:
ANNUAL REPORT 2009-10LIFE INSURANCE
- Page 144 and 145:
ANNUAL REPORT 2009-10INDIVIDUAL BUS
- Page 146 and 147:
ANNUAL REPORT 2009-10STATEMENT 27DE
- Page 148 and 149:
ANNUAL REPORT 2009-10REGION WISE DI
- Page 150 and 151:
ANNUAL REPORT 2009-10STATEMENT 31NE
- Page 152 and 153:
ANNUAL REPORT 2009-10Cont’d... ST
- Page 154 and 155:
ANNUAL REPORT 2009-10DEATH CLAIMS U
- Page 156 and 157:
ANNUAL REPORT 2009-10STATEMENT 35DU
- Page 158 and 159:
ANNUAL REPORT 2009-10LIST OF MICRO
- Page 160 and 161:
ANNUAL REPORT 2009-10SEGMENT WISE G
- Page 162 and 163:
ANNUAL REPORT 2009-10CHANNEL WISE G
- Page 164 and 165:
ANNUAL REPORT 2009-10STATEMENT 43NE
- Page 166 and 167:
ANNUAL REPORT 2009-10INCURRED CLAIM
- Page 168 and 169:
ANNUAL REPORT 2009-10UNDERWRITING E
- Page 170 and 171:
ANNUAL REPORT 2009-10ASSETS UNDER M
- Page 172 and 173:
ANNUAL REPORT 2009-10SOLVENCY RATIO
- Page 174 and 175:
ANNUAL REPORT 2009-10PUBLIC SECTOR
- Page 176 and 177:
ANNUAL REPORT 2009-10PUBLIC SECTOR
- Page 178 and 179:
ANNUAL REPORT 2009-10PRIVATE SECTOR
- Page 180 and 181:
ANNUAL REPORT 2009-10PRIVATE SECTOR
- Page 182 and 183:
ANNUAL REPORT 2009-10PRIVATE SECTOR
- Page 184 and 185:
ANNUAL REPORT 2009-10PRIVATE SECTOR
- Page 186 and 187:
ANNUAL REPORT 2009-10HEALTH INSURER
- Page 188 and 189:
ANNUAL REPORT 2009-10HEALTH INSURER
- Page 190 and 191:
ANNUAL REPORT 2009-10EXPORT CREDIT
- Page 192 and 193:
ANNUAL REPORT 2009-10AGRICULTURE IN
- Page 194 and 195:
ANNUAL REPORT 2009-10STATEMENT 65AG
- Page 196 and 197:
ANNUAL REPORT 2009-10STATEMENT 67GE
- Page 198 and 199:
ANNUAL REPORT 2009-10STATE-WISE NUM
- Page 200 and 201:
ANNUAL REPORT 2009-10STATEMENT 70TH
- Page 202 and 203:
ANNUAL REPORT 2009-10STATUS OF GRIE
- Page 204 and 205:
ANNUAL REPORT 2009-10STATUS OF GRIE
- Page 206 and 207:
ANNUAL REPORT 2009-10PERFORMANCE OF
- Page 208 and 209:
ANNUAL REPORT 2009-10PERFORMANCE OF
- Page 210 and 211:
ANNUAL REPORT 2009-10194
- Page 212 and 213:
ANNUAL REPORT 2009-10Cont’d... AN
- Page 214 and 215:
ANNUAL REPORT 2009-10INDIAN ASSURED
- Page 216 and 217:
ANNUAL REPORT 2009-10ANNEX 4LIFE IN
- Page 218 and 219:
ANNUAL REPORT 2009-10Cont’d... AN
- Page 220 and 221:
ANNUAL REPORT 2009-10Cont’d... AN
- Page 222 and 223:
ANNUAL REPORT 2009-10LIFE INSURANCE
- Page 224 and 225:
ANNUAL REPORT 2009-10NON-LIFE INSUR
- Page 226 and 227:
ANNUAL REPORT 2009-10NON-LIFE INSUR
- Page 228 and 229:
ANNUAL REPORT 2009-10STATE-WISE NUM
- Page 230 and 231:
ANNUAL REPORT 2009-10Cont’d... AN
- Page 232 and 233:
ANNUAL REPORT 2009-10Cont’d... AN
- Page 234 and 235:
ANNUAL REPORT 2009-10218
- Page 236 and 237:
ANNUAL REPORT 2009-10220
- Page 238 and 239:
ANNUAL REPORT 2009-10Authority (IRD
- Page 240 and 241:
1. Adequacy of Internal Audit Syste
- Page 242 and 243:
ANNUAL REPORT 2009-10INSURANCE REGU
- Page 244 and 245:
ANNUAL REPORT 2009-10INSURANCE REGU
- Page 246 and 247:
ANNUAL REPORT 2009-10INSURANCE REGU
- Page 248 and 249:
ANNUAL REPORT 2009-10INSURANCE REGU
- Page 250 and 251:
ANNUAL REPORT 2009-10INSURANCE REGU
- Page 252 and 253:
ANNUAL REPORT 2009-10INSURANCE REGU
- Page 254 and 255:
ANNUAL REPORT 2009-10INSURANCE REGU
- Page 256 and 257:
ANNUAL REPORT 2009-10INSURANCE REGU
- Page 258 and 259:
ANNUAL REPORT 2009-10ANNEXURE VIINS
- Page 260 and 261:
ANNUAL REPORT 2009-10ANNEXURE VIIII
- Page 262 and 263:
ANNUAL REPORT 2009-10(ii)License Fe
- Page 264 and 265:
dm{f©H$ [anmoQ>© 2009-10dm{f©H$
- Page 266 and 267:
dm{f©H$ [anmoQ>© 2009-10bú` H$WZ
- Page 268 and 269:
dm{f©H$ [anmoQ>© 2009-10^mJ-IVg§
- Page 270 and 271:
dm{f©H$ [anmoQ>© 2009-10{ddaUm| H
- Page 272 and 273:
dm{f©H$ [anmoQ>© 2009-10bú` H$WZ
- Page 274 and 275:
dm{f©H$ [anmoQ>© 2009-10A§e H$m{
- Page 276 and 277:
dm{f©H$ [anmoQ>© 2009-10g§`wº$
- Page 278 and 279:
dm{f©H$ [anmoQ>© 2009-10ñdmñÏ`
- Page 280 and 281:
Yeejleer³e DeLe&J³eJemLee:1. Yeej
- Page 282 and 283:
dm{f©H$ [anmoQ>© 2009-10hegve&yee
- Page 284 and 285:
dm{f©H$ [anmoQ>© 2009-10men³eesi
- Page 286 and 287:
dm{f©H$ [anmoQ>© 2009-10keÀe mec
- Page 288 and 289:
1. mççcççv³ç DçççÆLç&kç
- Page 290 and 291:
1.2.4 60 ÒççÆlçMçlç oíMçç
- Page 292 and 293:
dm{f©H$ [anmoQ>© 2009-10lçççÆ
- Page 294 and 295:
dm{f©H$ [anmoQ>© 2009-10Jç
- Page 296 and 297:
dm{f©H$ [anmoQ>© 2009-10lçççÆ
- Page 298 and 299:
1.3.22: çÆvçpççÇpççÇJçvç
- Page 300 and 301:
dm{f©H$ [anmoQ>© 2009-101.3.33: c
- Page 302 and 303:
dm{f©H$ [anmoQ>© 2009-10kçÀj Y
- Page 304 and 305:
dm{f©H$ [anmoQ>© 2009-10Yççjlç
- Page 306 and 307:
dm{f©H$ [anmoQ>© 2009-101.3.46 :
- Page 308 and 309:
dm{f©H$ [anmoQ>© 2009-10pçyçç
- Page 310 and 311:
dm{f©H$ [anmoQ>© 2009-10³çÓç
- Page 312 and 313:
dm{f©H$ [anmoQ>© 2009-10HçççÆ
- Page 314 and 315:
dm{f©H$ [anmoQ>© 2009-104.3 Hçá
- Page 316 and 317:
dm{f©H$ [anmoQ>© 2009-101.4.3.8 J
- Page 318 and 319:
dm{f©H$ [anmoQ>© 2009-10SkçÀ k
- Page 320 and 321:
dm{f©H$ [anmoQ>© 2009-10pççÇJ
- Page 322 and 323:
dm{f©H$ [anmoQ>© 2009-101.4.5.8 J
- Page 324 and 325:
dm{f©H$ [anmoQ>© 2009-10GHçjçí
- Page 326 and 327:
dm{f©H$ [anmoQ>© 2009-10lçççÆ
- Page 328 and 329:
Jç
- Page 330 and 331:
dm{f©H$ [anmoQ>© 2009-10pççíj
- Page 332 and 333:
dm{f©H$ [anmoQ>© 2009-104.9 YZ {d
- Page 334 and 335:
dm{f©H$ [anmoQ>© 2009-10çÆpçm
- Page 336 and 337:
dm{f©H$ [anmoQ>© 2009-10lçççÆ
- Page 338 and 339:
1. yççÇcçç DççÌj Hçávçy
- Page 340 and 341:
dm{f©H$ [anmoQ>© 2009-10lçççÆ
- Page 342 and 343:
dm{f©H$ [anmoQ>© 2009-10lçççÆ
- Page 344 and 345:
dm{f©H$ [anmoQ>© 2009-10II.3.2 y
- Page 346 and 347:
dm{f©H$ [anmoQ>© 2009-10³çn Dç
- Page 348 and 349:
II.5.3. yççÇcçç DççF&Dççj[
- Page 350 and 351:
dm{f©H$ [anmoQ>© 2009-10II.6.7. p
- Page 352 and 353:
dm{f©H$ [anmoQ>© 2009-10nÌ ScçD
- Page 354 and 355:
yççÇcçç çÆJççÆvç³ççc
- Page 356 and 357:
dm{f©H$ [anmoQ>© 2009-10DççF&D
- Page 358 and 359:
dm{f©H$ [anmoQ>© 2009-10{ZJ{_V em
- Page 360 and 361:
dm{f©H$ [anmoQ>© 2009-10Fmç cç
- Page 362 and 363:
dm{f©H$ [anmoQ>© 2009-10Yççiç
- Page 364 and 365:
dm{f©H$ [anmoQ>© 2009-10IV.6.7 ç
- Page 366 and 367:
dm{f©H$ [anmoQ>© 2009-10{ddaU87
- Page 368 and 369:
dm{f©H$ [anmoQ>© 2009-10~r_m nhþ
- Page 370 and 371:
{ddaU 3(`. H$amo‹S> _|)~r_mH$Vm©
- Page 372 and 373:
{ddaU 5OrdZ ~r_mH$Vm©Am| Ho$ ì`{
- Page 374 and 375:
{ddaU 6OrdZ ~r_mH$mVm©Am| H$m df©
- Page 376 and 377:
{ddaU 7(n«r{_`_ H$amoS> ` _|)amÁ`
- Page 378 and 379:
Omar {ddaU 7(n«r{_`_ H$amoS> ` _|)
- Page 380 and 381:
{ddaU 9(` H$amo‹S> _|)~r_mH$Vm©
- Page 382 and 383:
Omar {ddaU 10(n«r{_`_ H$amoS> ` _o
- Page 384 and 385:
{ddaU 12(bm^ am{e ` H$amo‹S> _|)O
- Page 386 and 387:
{ddaU 13(bm^ am{e ` H$amo‹S> _|)O
- Page 388 and 389:
{ddaU 14(bm^ am{e ` H$amo‹S> _|)O
- Page 390 and 391:
{ddaU 16(` H$amo‹S> _|)~r_mH$Vm©
- Page 392 and 393:
~r_mH$Vm© `y{ZQ> qbŠS> \§$S>AZw_
- Page 394 and 395:
dm{f©H$ [anmoQ>© 2009-10OrdZ ~r_m
- Page 396 and 397:
Omar {ddaU 19(` bmI _|)dm{f©H$ [an
- Page 398 and 399:
{ddaU 20(` bmIm| _|){ddaU {~abm gZ
- Page 400 and 401:
Omar {ddaU 20(` bmIm| _|){ddaU â`y
- Page 402 and 403:
Omar {ddaU 21(` bmIm| _o){ddaU ~OmO
- Page 404 and 405:
dm{f©H$ [anmoQ>© 2009-10^maVr` Or
- Page 406 and 407:
{Z{Y`m| Ho$ ómoVeò a ny§Ordm{f©
- Page 408 and 409:
dm{f©H$ [anmoQ>© 2009-10OrdZ ~r_m
- Page 410 and 411:
amÁ`/ EJmoZ A{ddm ~OmO ^maVr {~abm
- Page 412 and 413:
{ddaU 30amÁ`/ EJmoZ A{ddm ~OmO ^ma
- Page 414 and 415:
{ddaU 32(bm^ am{e ` H$amoS> _o)OrdZ
- Page 416 and 417:
{ddaU 33(bm^ am{e ` H$amoS> _o)OrdZ
- Page 418 and 419:
2009-10 Ho$ {b`o Ad{YAZwgma gyú_ ~
- Page 420 and 421:
dm{f©H$ [anmoQ>© 2009-10~r_mH$Vm
- Page 422 and 423:
J¡aOrdZ ~r_mH$Vm©Am| H$m gH$b à
- Page 424 and 425:
[ddaU 40(` bmIm| _|)~r_mH$Vm© A{¾
- Page 426 and 427:
ddaU 42(` bmIm| _o)amÁ`/Ho$ÝÐ A{
- Page 428 and 429:
A{¾ g_w{Ð _moQ>a ñdmñÏ` AÝ` 2
- Page 430 and 431:
[ddaU 46(` bmIm| _o){ddaU Ý`y B§{
- Page 432 and 433:
EMS>rE\$Or BaJmo â`yMa OZabr `w{Zd
- Page 434 and 435:
dm{f©H$ [anmoQ>© 2009-10J¡a OrdZ
- Page 436 and 437:
[ddaU 51(` bmIm| _o)Ý`y BpÊS>`m A
- Page 438 and 439:
{ddaU 52(` bmIm| _o){ddaU Ý`y B{Ý
- Page 440 and 441:
{ddaU am`b gwÝXa_ ~OmO Abm`§O Q>m
- Page 442 and 443:
Omar... {ddaU 54(` bmIm| _o){ddaU M
- Page 444 and 445:
{ddaU ahoOm Š`y~rB© Hw$bA{¾ g_w
- Page 446 and 447:
Omar... {ddaU 55(` bmIm| _|){ddaU E
- Page 448 and 449:
Omar.... {ddaU 56(` bmIm| _o){ddaU
- Page 450 and 451:
dm{f©H$ [anmoQ>© 2009-10ñdmñÏ`
- Page 452 and 453:
dm{f©H$ [anmoQ>© 2009-10^maVr` {Z
- Page 454 and 455:
dm{f©H$ [anmoQ>© 2009-10^maVr` {Z
- Page 456 and 457:
dm{f©H$ [anmoQ>© 2009-10^maVr` H
- Page 458 and 459:
{ddaU 66(` bmIm| _o)2009-10 2008-09
- Page 460 and 461:
dm{f©H$ [anmoQ>© 2009-10^maVr` gm
- Page 462 and 463:
J¡a OrdZ ~r_mH$VmAm| Ho$ amÁ`mZwg
- Page 464 and 465:
dm{f©H$ [anmoQ>© 2009-10Vrgam nj
- Page 466 and 467:
dm{f©H$ [anmoQ>© 2009-10{eH$m`Vm|
- Page 468 and 469:
dm{f©H$ [anmoQ>© 2009-10{eH$m`Vm|
- Page 470 and 471:
dm{f©H$ [anmoQ>© 2009-10{d{^Þ Ho
- Page 472 and 473:
dm{f©H$ [anmoQ>© 2009-10g§b½ZH$
- Page 474 and 475:
dm{f©H$ [anmoQ>© 2009-10^maV _o H
- Page 476 and 477:
dm{f©H$ [anmoQ>© 2009-10~r_m§H$V
- Page 478 and 479:
dm{f©H$ [anmoQ>© 2009-10^maVr` Or
- Page 480 and 481:
dm{f©H$ [anmoQ>© 2009-10{dÎm df
- Page 482 and 483:
dm{f©H$ [anmoQ>© 2009-10{dÎm df
- Page 484 and 485:
dm{f©H$ [anmoQ>© 2009-10{dÎm df
- Page 486 and 487:
dm{f©H$ [anmoQ>© 2009-10{dÎm df
- Page 488 and 489:
dm{f©H$ [anmoQ>© 2009-10{dÎm df
- Page 490 and 491:
g§b¾H$ 6dm{f©H$ [anmoQ>© 2009-1
- Page 492 and 493:
peejer... mebueivekeÀ 8DeÒewue 20
- Page 494 and 495:
peejer... mebueivekeÀ 8DeÒewue 20
- Page 496 and 497:
dm{f©H$ [anmoQ>© 2009-10H«$.g§.
- Page 498 and 499:
dm{f©H$ [anmoQ>© 2009-10g§b½ZH$
- Page 500 and 501:
dm{f©H$ [anmoQ>© 2009-1031 ¨ÉÉ
- Page 502 and 503:
dm{f©H$ [anmoQ>© 2009-10iÉnù{É
- Page 504 and 505:
nyd© df© Ho$ {bE AmH§$S>| Xm{`Ë
- Page 506 and 507:
- ã`mO (ZmoQ 3> XoI|) 2,752,030 gd
- Page 508 and 509:
Omar... ànÌ (gr)H«$.g§ àm{á`m
- Page 510 and 511:
~¢H$ àma§{^H$ E\$S>rAma O_m ã`m
- Page 512 and 513:
Omar... g§b¾H$ IIdm{f©H$ [anmoQ>
- Page 514 and 515:
dm{f©H$ [anmoQ>© 2009-10235~r_m {
- Page 516 and 517:
dm{f©H$ [anmoQ>© 2009-10237~r_m {
- Page 518 and 519:
dm{f©H$ [anmoQ>© 2009-10239~r_m {
- Page 520 and 521:
dm{f©H$ [anmoQ>© 2009-10~r_m {d{Z
- Page 522 and 523:
dm{f©H$ [anmoQ>© 2009-10~r_m {d{Z
- Page 524 and 525:
dm{f©H$ [anmoQ>© 2009-10g§b¾H$
- Page 526:
dm{f©H$ [anmoQ>© 2009-105) Yeejle