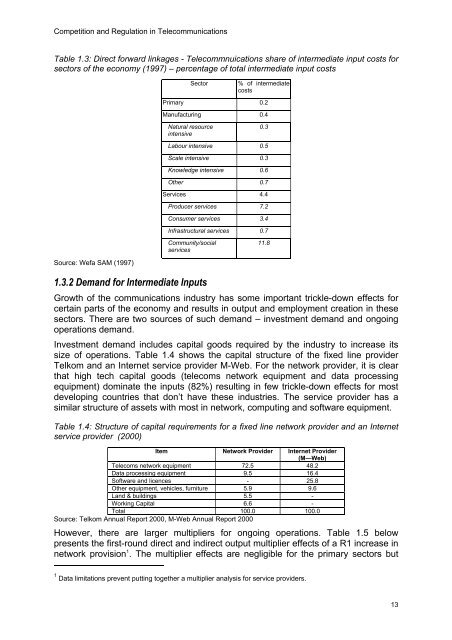
<strong>Competition</strong> <strong>and</strong> <strong>Regulation</strong> <strong>in</strong> <strong>Telecommunications</strong>callback services have sprung up <strong>in</strong> countries like <strong>the</strong> USA whereby a customer fromSouth Africa places a call ‘as if’ <strong>the</strong>y were <strong>in</strong> <strong>the</strong> USA through <strong>the</strong> callback operatorcall<strong>in</strong>g <strong>the</strong>m <strong>and</strong> connect<strong>in</strong>g <strong>the</strong>m to <strong>the</strong> number <strong>the</strong>y wanted to call. F<strong>in</strong>ally, <strong>in</strong>mobile telephony one can arrange <strong>in</strong>ternational roam<strong>in</strong>g agreements for mobilephone users to capture <strong>the</strong>ir consumption. Any calls that <strong>the</strong>y make abroad will berouted back through <strong>the</strong> domestic network, allow<strong>in</strong>g <strong>the</strong> domestic mobile networkprovider to capture some of <strong>the</strong> charges on that call.However, for basic voice products <strong>in</strong> <strong>the</strong> local access market, <strong>the</strong> competition mustcome from domestically situated firms. As such, provisions around foreign ownershiplimits will serve to restrict competition.1.3 Role <strong>in</strong> <strong>the</strong> economyCommunications services play a key role <strong>in</strong> any economy – from be<strong>in</strong>g an important<strong>in</strong>termediate <strong>in</strong>put to bus<strong>in</strong>ess, an enabl<strong>in</strong>g medium for a range of content providers,a significant item <strong>in</strong> household expenditure, <strong>and</strong> f<strong>in</strong>ally a source of dem<strong>and</strong> fornumerous manufactur<strong>in</strong>g <strong>and</strong> service <strong>in</strong>dustries. What follows is a discussion of <strong>the</strong>role <strong>in</strong> <strong>the</strong> broader economy of communications services as a package of bothnetwork <strong>and</strong> service providers. This component is severely limited by <strong>the</strong> statisticaldata. This is particularly problematic <strong>in</strong> a dynamic <strong>in</strong>dustry as dated statistics tend tobe widely off <strong>the</strong> mark. With telecommunications statistics, it is likely that datedstatistics will underestimate <strong>the</strong> role of <strong>the</strong> sector <strong>in</strong> <strong>the</strong> economy.1.3.1 Role as Intermediate InputThe role of communications as an <strong>in</strong>termediate to bus<strong>in</strong>ess can be seen to have 2dimensions – a) as a cost item required to operate a bus<strong>in</strong>ess, b) as a strategic <strong>and</strong>competitive tool.As a cost item, communications does not appear that significant for most parts of <strong>the</strong>South African economy judg<strong>in</strong>g from <strong>the</strong> statistics <strong>in</strong> table 1.3 below. It representsonly 0.1% of total costs <strong>in</strong> agriculture <strong>and</strong> m<strong>in</strong><strong>in</strong>g, 0.4% <strong>in</strong> manufactur<strong>in</strong>g <strong>in</strong>dustries<strong>and</strong> 4.4% <strong>in</strong> service <strong>in</strong>dustries. However, <strong>the</strong>se figures def<strong>in</strong>itely underestimate <strong>the</strong>cost importance of communications for two important reasons. First, <strong>the</strong> data networkcosts are accounted for under <strong>the</strong> section titled bus<strong>in</strong>ess services, along with o<strong>the</strong>rbus<strong>in</strong>ess service items. Second, <strong>the</strong> latest <strong>in</strong>put-output data available for SouthAfrica is 1997, which was based on <strong>the</strong> 1993 table which was based on <strong>the</strong> 1988table. In each case, a new <strong>in</strong>put-output table is created by adjust<strong>in</strong>g <strong>the</strong> old one withnew national accounts data.As a strategic competitive tool, communications are becom<strong>in</strong>g more <strong>and</strong> more vital tobus<strong>in</strong>esses globally. Increased globalisation has resulted <strong>in</strong> <strong>the</strong> requirement tocommunicate <strong>and</strong> transmit vast amounts of data to suppliers, <strong>in</strong>dustry customers <strong>and</strong>affiliates <strong>in</strong>ternationally on a timely basis. The rise of electronic commerce, has nowestablished a need <strong>in</strong> many <strong>in</strong>dustries to use communications networks to deal with<strong>the</strong> f<strong>in</strong>al dem<strong>and</strong> of <strong>the</strong> household consumer too. In both cases, <strong>the</strong> need is for highspeed, high quality communications services that are geared to <strong>the</strong> specific needs of<strong>the</strong> firm <strong>and</strong> which are available at a cost that does not make it prohibitive tocommunicate or put <strong>the</strong>m at a competitive disadvantage to firms <strong>in</strong> o<strong>the</strong>r countries.What matters most for an economy is <strong>the</strong> availability of world-class communicationservices at a reasonably competitive price, even if <strong>the</strong>y are not <strong>the</strong> cheapest.12
<strong>Competition</strong> <strong>and</strong> <strong>Regulation</strong> <strong>in</strong> <strong>Telecommunications</strong>Table 1.3: Direct forward l<strong>in</strong>kages - Telecommnuications share of <strong>in</strong>termediate <strong>in</strong>put costs forsectors of <strong>the</strong> economy (1997) – percentage of total <strong>in</strong>termediate <strong>in</strong>put costsSector% of <strong>in</strong>termediatecostsPrimary 0.2Manufactur<strong>in</strong>g 0.4Natural resource<strong>in</strong>tensive0.3Labour <strong>in</strong>tensive 0.5Scale <strong>in</strong>tensive 0.3Knowledge <strong>in</strong>tensive 0.6O<strong>the</strong>r 0.7Services 4.4Producer services 7.2Consumer services 3.4Infrastructural services 0.7Community/socialservices11.8Source: Wefa SAM (1997)1.3.2 Dem<strong>and</strong> for Intermediate InputsGrowth of <strong>the</strong> communications <strong>in</strong>dustry has some important trickle-down effects forcerta<strong>in</strong> parts of <strong>the</strong> economy <strong>and</strong> results <strong>in</strong> output <strong>and</strong> employment creation <strong>in</strong> <strong>the</strong>sesectors. There are two sources of such dem<strong>and</strong> – <strong>in</strong>vestment dem<strong>and</strong> <strong>and</strong> ongo<strong>in</strong>goperations dem<strong>and</strong>.Investment dem<strong>and</strong> <strong>in</strong>cludes capital goods required by <strong>the</strong> <strong>in</strong>dustry to <strong>in</strong>crease itssize of operations. Table 1.4 shows <strong>the</strong> capital structure of <strong>the</strong> fixed l<strong>in</strong>e providerTelkom <strong>and</strong> an Internet service provider M-Web. For <strong>the</strong> network provider, it is clearthat high tech capital goods (telecoms network equipment <strong>and</strong> data process<strong>in</strong>gequipment) dom<strong>in</strong>ate <strong>the</strong> <strong>in</strong>puts (82%) result<strong>in</strong>g <strong>in</strong> few trickle-down effects for mostdevelop<strong>in</strong>g countries that don’t have <strong>the</strong>se <strong>in</strong>dustries. The service provider has asimilar structure of assets with most <strong>in</strong> network, comput<strong>in</strong>g <strong>and</strong> software equipment.Table 1.4: Structure of capital requirements for a fixed l<strong>in</strong>e network provider <strong>and</strong> an Internetservice provider (2000)Item Network Provider Internet Provider(M—Web)Telecoms network equipment 72.5 48.2Data process<strong>in</strong>g equipment 9.5 16.4Software <strong>and</strong> licences - 25.8O<strong>the</strong>r equipment, vehicles, furniture 5.9 9.6L<strong>and</strong> & build<strong>in</strong>gs 5.5 -Work<strong>in</strong>g Capital 6.6 -Total 100.0 100.0Source: Telkom Annual Report 2000, M-Web Annual Report 2000However, <strong>the</strong>re are larger multipliers for ongo<strong>in</strong>g operations. Table 1.5 belowpresents <strong>the</strong> first-round direct <strong>and</strong> <strong>in</strong>direct output multiplier effects of a R1 <strong>in</strong>crease <strong>in</strong>network provision 1 . The multiplier effects are negligible for <strong>the</strong> primary sectors but1 Data limitations prevent putt<strong>in</strong>g toge<strong>the</strong>r a multiplier analysis for service providers.13