October - December 2012 - National Institute of Rural Development
October - December 2012 - National Institute of Rural Development
October - December 2012 - National Institute of Rural Development
- No tags were found...
Create successful ePaper yourself
Turn your PDF publications into a flip-book with our unique Google optimized e-Paper software.
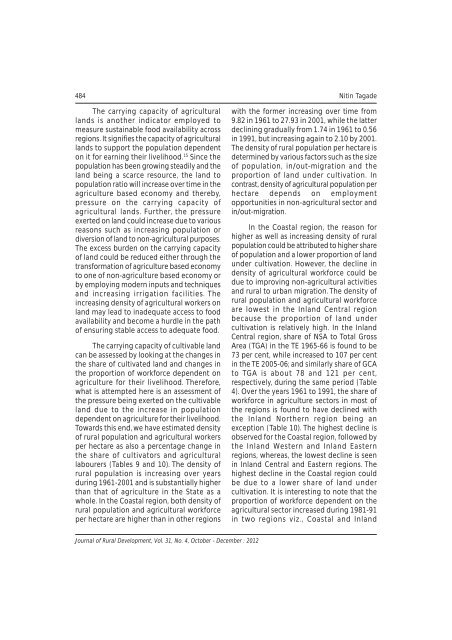
484 Nitin TagadeThe carrying capacity <strong>of</strong> agriculturallands is another indicator employed tomeasure sustainable food availability acrossregions. It signifies the capacity <strong>of</strong> agriculturallands to support the population dependenton it for earning their livelihood. 15 Since thepopulation has been growing steadily and theland being a scarce resource, the land topopulation ratio will increase over time in theagriculture based economy and thereby,pressure on the carrying capacity <strong>of</strong>agricultural lands. Further, the pressureexerted on land could increase due to variousreasons such as increasing population ordiversion <strong>of</strong> land to non-agricultural purposes.The excess burden on the carrying capacity<strong>of</strong> land could be reduced either through thetransformation <strong>of</strong> agriculture based economyto one <strong>of</strong> non-agriculture based economy orby employing modern inputs and techniquesand increasing irrigation facilities. Theincreasing density <strong>of</strong> agricultural workers onland may lead to inadequate access to foodavailability and become a hurdle in the path<strong>of</strong> ensuring stable access to adequate food.The carrying capacity <strong>of</strong> cultivable landcan be assessed by looking at the changes inthe share <strong>of</strong> cultivated land and changes inthe proportion <strong>of</strong> workforce dependent onagriculture for their livelihood. Therefore,what is attempted here is an assessment <strong>of</strong>the pressure being exerted on the cultivableland due to the increase in populationdependent on agriculture for their livelihood.Towards this end, we have estimated density<strong>of</strong> rural population and agricultural workersper hectare as also a percentage change inthe share <strong>of</strong> cultivators and agriculturallabourers (Tables 9 and 10). The density <strong>of</strong>rural population is increasing over yearsduring 1961-2001 and is substantially higherthan that <strong>of</strong> agriculture in the State as awhole. In the Coastal region, both density <strong>of</strong>rural population and agricultural workforceper hectare are higher than in other regionswith the former increasing over time from9.82 in 1961 to 27.93 in 2001, while the latterdeclining gradually from 1.74 in 1961 to 0.56in 1991, but increasing again to 2.10 by 2001.The density <strong>of</strong> rural population per hectare isdetermined by various factors such as the size<strong>of</strong> population, in/out-migration and theproportion <strong>of</strong> land under cultivation. Incontrast, density <strong>of</strong> agricultural population perhectare depends on employmentopportunities in non-agricultural sector andin/out-migration.In the Coastal region, the reason forhigher as well as increasing density <strong>of</strong> ruralpopulation could be attributed to higher share<strong>of</strong> population and a lower proportion <strong>of</strong> landunder cultivation. However, the decline indensity <strong>of</strong> agricultural workforce could bedue to improving non-agricultural activitiesand rural to urban migration. The density <strong>of</strong>rural population and agricultural workforceare lowest in the Inland Central regionbecause the proportion <strong>of</strong> land undercultivation is relatively high. In the InlandCentral region, share <strong>of</strong> NSA to Total GrossArea (TGA) in the TE 1965-66 is found to be73 per cent, while increased to 107 per centin the TE 2005-06; and similarly share <strong>of</strong> GCAto TGA is about 78 and 121 per cent,respectively, during the same period (Table4). Over the years 1961 to 1991, the share <strong>of</strong>workforce in agriculture sectors in most <strong>of</strong>the regions is found to have declined withthe Inland Northern region being anexception (Table 10). The highest decline isobserved for the Coastal region, followed bythe Inland Western and Inland Easternregions, whereas, the lowest decline is seenin Inland Central and Eastern regions. Thehighest decline in the Coastal region couldbe due to a lower share <strong>of</strong> land undercultivation. It is interesting to note that theproportion <strong>of</strong> workforce dependent on theagricultural sector increased during 1981-91in two regions viz., Coastal and InlandJournal <strong>of</strong> <strong>Rural</strong> <strong>Development</strong>, Vol. 31, No. 4, <strong>October</strong> - <strong>December</strong> : <strong>2012</strong>


