October - December 2012 - National Institute of Rural Development
October - December 2012 - National Institute of Rural Development
October - December 2012 - National Institute of Rural Development
- No tags were found...

Create successful ePaper yourself
Turn your PDF publications into a flip-book with our unique Google optimized e-Paper software.
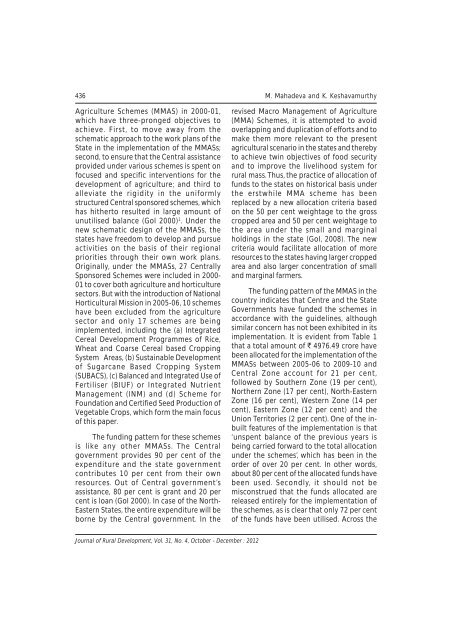
436 M. Mahadeva and K. KeshavamurthyAgriculture Schemes (MMAS) in 2000-01,which have three-pronged objectives toachieve. First, to move away from theschematic approach to the work plans <strong>of</strong> theState in the implementation <strong>of</strong> the MMASs;second, to ensure that the Central assistanceprovided under various schemes is spent onfocused and specific interventions for thedevelopment <strong>of</strong> agriculture; and third toalleviate the rigidity in the uniformlystructured Central sponsored schemes, whichhas hitherto resulted in large amount <strong>of</strong>unutilised balance (GoI 2000) 1 . Under thenew schematic design <strong>of</strong> the MMASs, thestates have freedom to develop and pursueactivities on the basis <strong>of</strong> their regionalpriorities through their own work plans.Originally, under the MMASs, 27 CentrallySponsored Schemes were included in 2000-01 to cover both agriculture and horticulturesectors. But with the introduction <strong>of</strong> <strong>National</strong>Horticultural Mission in 2005-06, 10 schemeshave been excluded from the agriculturesector and only 17 schemes are beingimplemented, including the (a) IntegratedCereal <strong>Development</strong> Programmes <strong>of</strong> Rice,Wheat and Coarse Cereal based CroppingSystem Areas, (b) Sustainable <strong>Development</strong><strong>of</strong> Sugarcane Based Cropping System(SUBACS), (c) Balanced and Integrated Use <strong>of</strong>Fertiliser (BIUF) or Integrated NutrientManagement (INM) and (d) Scheme forFoundation and Certified Seed Production <strong>of</strong>Vegetable Crops, which form the main focus<strong>of</strong> this paper.The funding pattern for these schemesis like any other MMASs. The Centralgovernment provides 90 per cent <strong>of</strong> theexpenditure and the state governmentcontributes 10 per cent from their ownresources. Out <strong>of</strong> Central government’sassistance, 80 per cent is grant and 20 percent is loan (GoI 2000). In case <strong>of</strong> the North-Eastern States, the entire expenditure will beborne by the Central government. In therevised Macro Management <strong>of</strong> Agriculture(MMA) Schemes, it is attempted to avoidoverlapping and duplication <strong>of</strong> efforts and tomake them more relevant to the presentagricultural scenario in the states and therebyto achieve twin objectives <strong>of</strong> food securityand to improve the livelihood system forrural mass. Thus, the practice <strong>of</strong> allocation <strong>of</strong>funds to the states on historical basis underthe erstwhile MMA scheme has beenreplaced by a new allocation criteria basedon the 50 per cent weightage to the grosscropped area and 50 per cent weightage tothe area under the small and marginalholdings in the state (GoI, 2008). The newcriteria would facilitate allocation <strong>of</strong> moreresources to the states having larger croppedarea and also larger concentration <strong>of</strong> smalland marginal farmers.The funding pattern <strong>of</strong> the MMAS in thecountry indicates that Centre and the StateGovernments have funded the schemes inaccordance with the guidelines, althoughsimilar concern has not been exhibited in itsimplementation. It is evident from Table 1that a total amount <strong>of</strong> ` 4976.49 crore havebeen allocated for the implementation <strong>of</strong> theMMASs between 2005-06 to 2009-10 andCentral Zone account for 21 per cent,followed by Southern Zone (19 per cent),Northern Zone (17 per cent), North-EasternZone (16 per cent), Western Zone (14 percent), Eastern Zone (12 per cent) and theUnion Territories (2 per cent). One <strong>of</strong> the inbuiltfeatures <strong>of</strong> the implementation is that‘unspent balance <strong>of</strong> the previous years isbeing carried forward to the total allocationunder the schemes’, which has been in theorder <strong>of</strong> over 20 per cent. In other words,about 80 per cent <strong>of</strong> the allocated funds havebeen used. Secondly, it should not bemisconstrued that the funds allocated arereleased entirely for the implementation <strong>of</strong>the schemes, as is clear that only 72 per cent<strong>of</strong> the funds have been utilised. Across theJournal <strong>of</strong> <strong>Rural</strong> <strong>Development</strong>, Vol. 31, No. 4, <strong>October</strong> - <strong>December</strong> : <strong>2012</strong>