October - December 2012 - National Institute of Rural Development
October - December 2012 - National Institute of Rural Development
October - December 2012 - National Institute of Rural Development
- No tags were found...

Create successful ePaper yourself
Turn your PDF publications into a flip-book with our unique Google optimized e-Paper software.
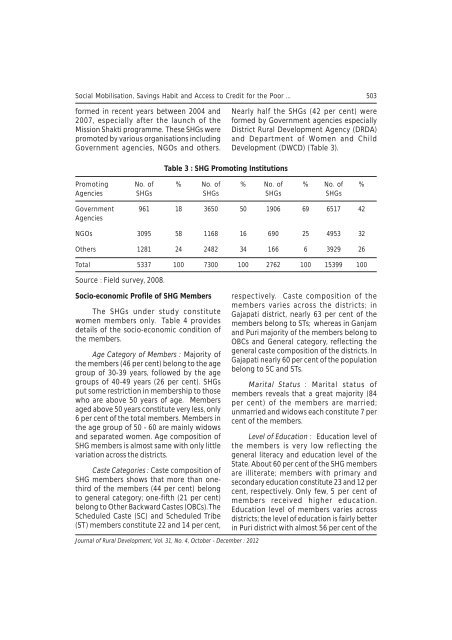
Social Mobilisation, Savings Habit and Access to Credit for the Poor ... 503formed in recent years between 2004 and2007, especially after the launch <strong>of</strong> theMission Shakti programme. These SHGs werepromoted by various organisations includingGovernment agencies, NGOs and others.Nearly half the SHGs (42 per cent) wereformed by Government agencies especiallyDistrict <strong>Rural</strong> <strong>Development</strong> Agency (DRDA)and Department <strong>of</strong> Women and Child<strong>Development</strong> (DWCD) (Table 3).Table 3 : SHG Promoting InstitutionsPromoting No. <strong>of</strong> % No. <strong>of</strong> % No. <strong>of</strong> % No. <strong>of</strong> %Agencies SHGs SHGs SHGs SHGsGovernment 961 18 3650 50 1906 69 6517 42AgenciesNGOs 3095 58 1168 16 690 25 4953 32Others 1281 24 2482 34 166 6 3929 26Total 5337 100 7300 100 2762 100 15399 100Source : Field survey, 2008.Socio-economic Pr<strong>of</strong>ile <strong>of</strong> SHG MembersThe SHGs under study constitutewomen members only. Table 4 providesdetails <strong>of</strong> the socio-economic condition <strong>of</strong>the members.Age Category <strong>of</strong> Members : Majority <strong>of</strong>the members (46 per cent) belong to the agegroup <strong>of</strong> 30-39 years, followed by the agegroups <strong>of</strong> 40-49 years (26 per cent). SHGsput some restriction in membership to thosewho are above 50 years <strong>of</strong> age. Membersaged above 50 years constitute very less, only6 per cent <strong>of</strong> the total members. Members inthe age group <strong>of</strong> 50 - 60 are mainly widowsand separated women. Age composition <strong>of</strong>SHG members is almost same with only littlevariation across the districts.Caste Categories : Caste composition <strong>of</strong>SHG members shows that more than onethird<strong>of</strong> the members (44 per cent) belongto general category; one-fifth (21 per cent)belong to Other Backward Castes (OBCs). TheScheduled Caste (SC) and Scheduled Tribe(ST) members constitute 22 and 14 per cent,Journal <strong>of</strong> <strong>Rural</strong> <strong>Development</strong>, Vol. 31, No. 4, <strong>October</strong> - <strong>December</strong> : <strong>2012</strong>respectively. Caste composition <strong>of</strong> themembers varies across the districts; inGajapati district, nearly 63 per cent <strong>of</strong> themembers belong to STs; whereas in Ganjamand Puri majority <strong>of</strong> the members belong toOBCs and General category, reflecting thegeneral caste composition <strong>of</strong> the districts. InGajapati nearly 60 per cent <strong>of</strong> the populationbelong to SC and STs.Marital Status : Marital status <strong>of</strong>members reveals that a great majority (84per cent) <strong>of</strong> the members are married;unmarried and widows each constitute 7 percent <strong>of</strong> the members.Level <strong>of</strong> Education : Education level <strong>of</strong>the members is very low reflecting thegeneral literacy and education level <strong>of</strong> theState. About 60 per cent <strong>of</strong> the SHG membersare illiterate; members with primary andsecondary education constitute 23 and 12 percent, respectively. Only few, 5 per cent <strong>of</strong>members received higher education.Education level <strong>of</strong> members varies acrossdistricts; the level <strong>of</strong> education is fairly betterin Puri district with almost 56 per cent <strong>of</strong> the