October - December 2012 - National Institute of Rural Development
October - December 2012 - National Institute of Rural Development
October - December 2012 - National Institute of Rural Development
- No tags were found...

You also want an ePaper? Increase the reach of your titles
YUMPU automatically turns print PDFs into web optimized ePapers that Google loves.
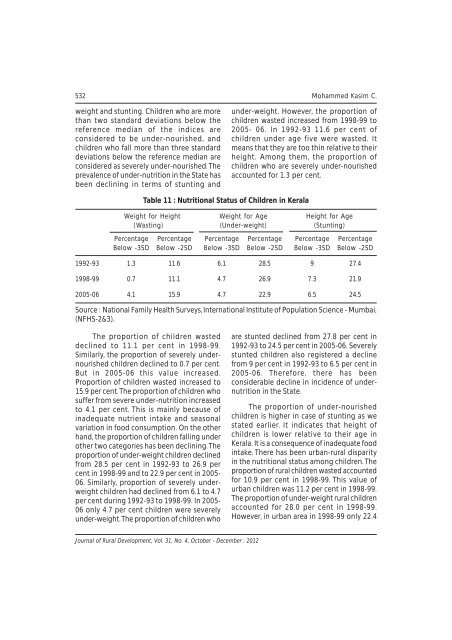
532 Mohammed Kasim C.weight and stunting. Children who are morethan two standard deviations below thereference median <strong>of</strong> the indices areconsidered to be under-nourished, andchildren who fall more than three standarddeviations below the reference median areconsidered as severely under-nourished. Theprevalence <strong>of</strong> under-nutrition in the State hasbeen declining in terms <strong>of</strong> stunting andunder-weight. However, the proportion <strong>of</strong>children wasted increased from 1998-99 to2005- 06. In 1992-93 11.6 per cent <strong>of</strong>children under age five were wasted. Itmeans that they are too thin relative to theirheight. Among them, the proportion <strong>of</strong>children who are severely under-nourishedaccounted for 1.3 per cent.Table 11 : Nutritional Status <strong>of</strong> Children in KeralaWeight for Height Weight for Age Height for Age(Wasting) (Under-weight) (Stunting)Percentage Percentage Percentage Percentage Percentage PercentageBelow -3SD Below -2SD Below -3SD Below -2SD Below -3SD Below -2SD1992-93 1.3 11.6 6.1 28.5 9 27.41998-99 0.7 11.1 4.7 26.9 7.3 21.92005-06 4.1 15.9 4.7 22.9 6.5 24.5Source : <strong>National</strong> Family Health Surveys, International <strong>Institute</strong> <strong>of</strong> Population Science - Mumbai,(NFHS-2&3).The proportion <strong>of</strong> children wasteddeclined to 11.1 per cent in 1998-99.Similarly, the proportion <strong>of</strong> severely undernourishedchildren declined to 0.7 per cent.But in 2005-06 this value increased.Proportion <strong>of</strong> children wasted increased to15.9 per cent. The proportion <strong>of</strong> children whosuffer from severe under-nutrition increasedto 4.1 per cent. This is mainly because <strong>of</strong>inadequate nutrient intake and seasonalvariation in food consumption. On the otherhand, the proportion <strong>of</strong> children falling underother two categories has been declining. Theproportion <strong>of</strong> under-weight children declinedfrom 28.5 per cent in 1992-93 to 26.9 percent in 1998-99 and to 22.9 per cent in 2005-06. Similarly, proportion <strong>of</strong> severely underweightchildren had declined from 6.1 to 4.7per cent during 1992-93 to 1998-99. In 2005-06 only 4.7 per cent children were severelyunder-weight. The proportion <strong>of</strong> children whoare stunted declined from 27.8 per cent in1992-93 to 24.5 per cent in 2005-06. Severelystunted children also registered a declinefrom 9 per cent in 1992-93 to 6.5 per cent in2005-06. Therefore, there has beenconsiderable decline in incidence <strong>of</strong> undernutritionin the State.The proportion <strong>of</strong> under-nourishedchildren is higher in case <strong>of</strong> stunting as westated earlier. It indicates that height <strong>of</strong>children is lower relative to their age inKerala. It is a consequence <strong>of</strong> inadequate foodintake. There has been urban-rural disparityin the nutritional status among children. Theproportion <strong>of</strong> rural children wasted accountedfor 10.9 per cent in 1998-99. This value <strong>of</strong>urban children was 11.2 per cent in 1998-99.The proportion <strong>of</strong> under-weight rural childrenaccounted for 28.0 per cent in 1998-99.However, in urban area in 1998-99 only 22.4Journal <strong>of</strong> <strong>Rural</strong> <strong>Development</strong>, Vol. 31, No. 4, <strong>October</strong> - <strong>December</strong> : <strong>2012</strong>