October - December 2012 - National Institute of Rural Development
October - December 2012 - National Institute of Rural Development
October - December 2012 - National Institute of Rural Development
- No tags were found...

Create successful ePaper yourself
Turn your PDF publications into a flip-book with our unique Google optimized e-Paper software.
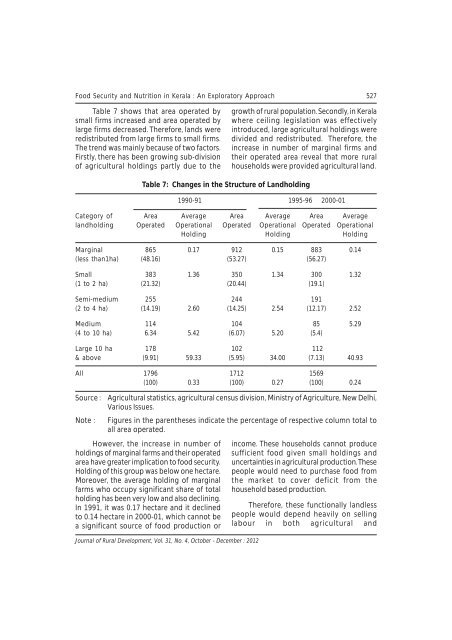
Food Security and Nutrition in Kerala : An Exploratory Approach 527Table 7 shows that area operated bysmall firms increased and area operated bylarge firms decreased. Therefore, lands wereredistributed from large firms to small firms.The trend was mainly because <strong>of</strong> two factors.Firstly, there has been growing sub-division<strong>of</strong> agricultural holdings partly due to thegrowth <strong>of</strong> rural population. Secondly, in Keralawhere ceiling legislation was effectivelyintroduced, large agricultural holdings weredivided and redistributed. Therefore, theincrease in number <strong>of</strong> marginal firms andtheir operated area reveal that more ruralhouseholds were provided agricultural land.Table 7: Changes in the Structure <strong>of</strong> LandholdingJournal <strong>of</strong> <strong>Rural</strong> <strong>Development</strong>, Vol. 31, No. 4, <strong>October</strong> - <strong>December</strong> : <strong>2012</strong>1990-91 1995-96 2000-01Category <strong>of</strong> Area Average Area Average Area Averagelandholding Operated Operational Operated Operational Operated OperationalHolding Holding HoldingMarginal 865 0.17 912 0.15 883 0.14(less than1ha) (48.16) (53.27) (56.27)Small 383 1.36 350 1.34 300 1.32(1 to 2 ha) (21.32) (20.44) (19.1)Semi-medium 255 244 191(2 to 4 ha) (14.19) 2.60 (14.25) 2.54 (12.17) 2.52Medium 114 104 85 5.29(4 to 10 ha) 6.34 5.42 (6.07) 5.20 (5.4)Large 10 ha 178 102 112& above (9.91) 59.33 (5.95) 34.00 (7.13) 40.93All 1796 1712 1569(100) 0.33 (100) 0.27 (100) 0.24Source :Note :Agricultural statistics, agricultural census division, Ministry <strong>of</strong> Agriculture, New Delhi,Various Issues.Figures in the parentheses indicate the percentage <strong>of</strong> respective column total toall area operated.However, the increase in number <strong>of</strong>holdings <strong>of</strong> marginal farms and their operatedarea have greater implication to food security.Holding <strong>of</strong> this group was below one hectare.Moreover, the average holding <strong>of</strong> marginalfarms who occupy significant share <strong>of</strong> totalholding has been very low and also declining.In 1991, it was 0.17 hectare and it declinedto 0.14 hectare in 2000-01, which cannot bea significant source <strong>of</strong> food production orincome. These households cannot producesufficient food given small holdings anduncertainties in agricultural production. Thesepeople would need to purchase food fromthe market to cover deficit from thehousehold based production.Therefore, these functionally landlesspeople would depend heavily on sellinglabour in both agricultural and