October - December 2012 - National Institute of Rural Development
October - December 2012 - National Institute of Rural Development
October - December 2012 - National Institute of Rural Development
- No tags were found...

You also want an ePaper? Increase the reach of your titles
YUMPU automatically turns print PDFs into web optimized ePapers that Google loves.
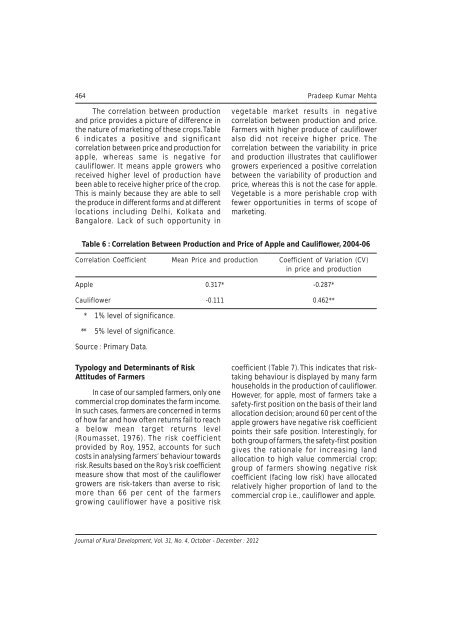
464 Pradeep Kumar MehtaThe correlation between productionand price provides a picture <strong>of</strong> difference inthe nature <strong>of</strong> marketing <strong>of</strong> these crops. Table6 indicates a positive and significantcorrelation between price and production forapple, whereas same is negative forcauliflower. It means apple growers whoreceived higher level <strong>of</strong> production havebeen able to receive higher price <strong>of</strong> the crop.This is mainly because they are able to sellthe produce in different forms and at differentlocations including Delhi, Kolkata andBangalore. Lack <strong>of</strong> such opportunity invegetable market results in negativecorrelation between production and price.Farmers with higher produce <strong>of</strong> caulifloweralso did not receive higher price. Thecorrelation between the variability in priceand production illustrates that cauliflowergrowers experienced a positive correlationbetween the variability <strong>of</strong> production andprice, whereas this is not the case for apple.Vegetable is a more perishable crop withfewer opportunities in terms <strong>of</strong> scope <strong>of</strong>marketing.Table 6 : Correlation Between Production and Price <strong>of</strong> Apple and Cauliflower, 2004-06Correlation Coefficient Mean Price and production Coefficient <strong>of</strong> Variation (CV)in price and productionApple 0.317* -0.287*Cauliflower -0.111 0.462*** 1% level <strong>of</strong> significance.** 5% level <strong>of</strong> significance.Source : Primary Data.Typology and Determinants <strong>of</strong> RiskAttitudes <strong>of</strong> FarmersIn case <strong>of</strong> our sampled farmers, only onecommercial crop dominates the farm income.In such cases, farmers are concerned in terms<strong>of</strong> how far and how <strong>of</strong>ten returns fail to reacha below mean target returns level(Roumasset, 1976). The risk coefficientprovided by Roy, 1952, accounts for suchcosts in analysing farmers’ behaviour towardsrisk. Results based on the Roy’s risk coefficientmeasure show that most <strong>of</strong> the cauliflowergrowers are risk-takers than averse to risk;more than 66 per cent <strong>of</strong> the farmersgrowing cauliflower have a positive riskcoefficient (Table 7). This indicates that risktakingbehaviour is displayed by many farmhouseholds in the production <strong>of</strong> cauliflower.However, for apple, most <strong>of</strong> farmers take asafety-first position on the basis <strong>of</strong> their landallocation decision; around 60 per cent <strong>of</strong> theapple growers have negative risk coefficientpoints their safe position. Interestingly, forboth group <strong>of</strong> farmers, the safety-first positiongives the rationale for increasing landallocation to high value commercial crop;group <strong>of</strong> farmers showing negative riskcoefficient (facing low risk) have allocatedrelatively higher proportion <strong>of</strong> land to thecommercial crop i.e., cauliflower and apple.Journal <strong>of</strong> <strong>Rural</strong> <strong>Development</strong>, Vol. 31, No. 4, <strong>October</strong> - <strong>December</strong> : <strong>2012</strong>