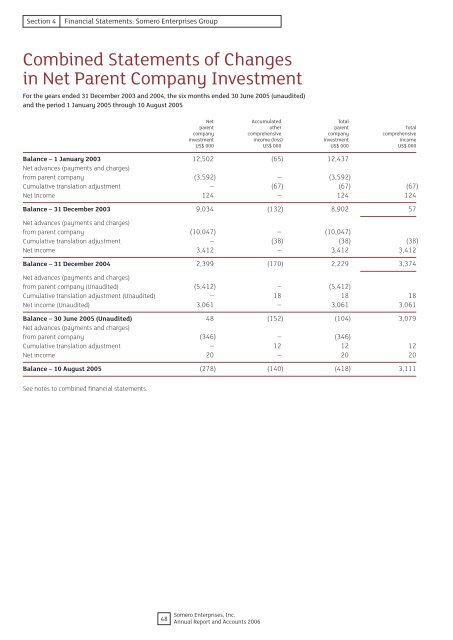
Section 4Financial Statements: <strong>Somero</strong> <strong>Enterprises</strong> GroupCombined Statements of Changesin Net Parent Company InvestmentFor the years ended 31 December 2003 and 2004, the six months ended 30 June 2005 (unaudited)and the period 1 January 2005 through 10 August 2005Net Accumulated Totalparent other parent Totalcompany comprehensive company comprehensiveinvestment income (loss) investment incomeUS$ 000 US$ 000 US$ 000 US$ 000Balance – 1 January 2003 12,502 (65) 12,437Net advances (payments and charges)from parent company (3,592) – (3,592)Cumulative translation adjustment – (67) (67) (67)Net income 124 – 124 124Balance – 31 December 2003 9,034 (132) 8,902 57Net advances (payments and charges)from parent company (10,047) – (10,047)Cumulative translation adjustment – (38) (38) (38)Net income 3,412 – 3,412 3,412Balance – 31 December 2004 2,399 (170) 2,229 3,374Net advances (payments and charges)from parent company (Unaudited) (5,412) – (5,412)Cumulative translation adjustment (Unaudited) – 18 18 18Net income (Unaudited) 3,061 – 3,061 3,061Balance – 30 June 2005 (Unaudited) 48 (152) (104) 3,079Net advances (payments and charges)from parent company (346) – (346)Cumulative translation adjustment – 12 12 12Net income 20 – 20 20Balance – 10 August 2005 (278) (140) (418) 3,111See notes to combined financial statements.48<strong>Somero</strong> <strong>Enterprises</strong>, Inc.Annual Report and Accounts 2006
Section 4Financial Statements: <strong>Somero</strong> <strong>Enterprises</strong> GroupCombined Statement of Cash FlowsFor the years ended 31 December 2003 and 2004, the six months ended 30 June 2005 (unaudited)and the period 1 January 2005 through 10 August 2005Six monthsYear ended Year ended ended 1 January 200531 December 31 December 30 June 2005 through2003 2004 (Unaudited) 10 August 2005US$ 000 US$ 000 US$ 000 US$ 000Cash flows from operating activities:Net income 124 3,412 3,061 3,081Adjustments to reconcile net income to net cashprovided by operating activities:Deferred taxes (318) (389) (408) (537)Depreciation and amortisation 1,616 1,552 707 858Loss on sale of assets 52 – 20 20Working capital changes:Accounts receivable 338 969 (1,099) (967)Inventories 3,525 1,886 187 (181)Prepaid expenses and other current assets 104 (129) 136 126Other assets (35) – 2 (10)Accounts payable and other liabilities 373 762 723 1,170Income taxes payable 2,115 2,058 2,041 2,184Net cash provided by operating activities 7,894 10,121 5,370 5,744Cash flows from investing activities:Proceeds from sale of property and equipment 693 7 98 103Property and equipment purchases (614) (359) (69) (118)Net cash provided by investing activities 79 (352) 29 (15)Cash flows from financing activities:Payments for notes payable (5,023) – – –Change in net parent company investment (3,592) (10,047) (5,412) (5,758)Net cash provided by financing activities (8,615) (10,047) (5,412) (5,758)Effect of exchange rates on cash and cash equivalents (66) (40) 18 30Net (decrease) increase in cash and cash equivalents (708) (318) 5 1Cash and cash equivalents:Beginning of period 1,034 326 8 8End of period 326 8 13 9Supplemental cash flow disclosures:Cash paid for interest 444 411 246 307Cash paid for taxes 49 150 42 54Cash received for tax refunds 1,921 94 13 13See notes to combined financial statements.49<strong>Somero</strong> <strong>Enterprises</strong>, Inc.Annual Report and Accounts 2006