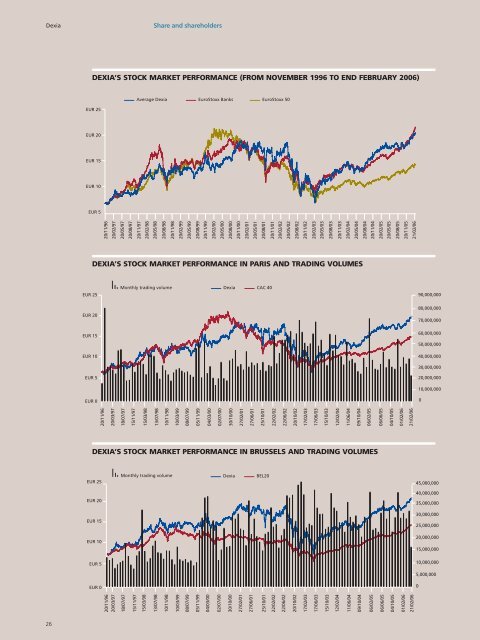
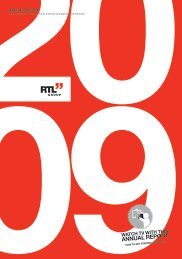
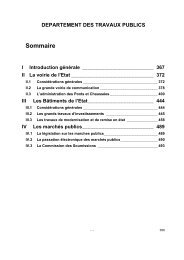
<strong>Dexia</strong>Share and shareholdersDEXIA’S STOCK MARKET PERFORMANCE (FROM NOVEMBER 1996 TO END FEBRUARY 2006)EUR 25Average <strong>Dexia</strong> EuroStoxx Banks EuroStoxx 50EUR 20EUR 15EUR 10EUR 520/11/9620/02/9720/05/9720/08/9720/11/9720/02/9820/05/9820/08/9820/11/9820/02/9920/05/9920/08/9920/11/9920/02/0020/05/0020/08/0020/11/0020/02/0120/05/0120/08/0120/11/0120/02/0220/05/0220/08/0220/11/0220/02/0320/05/0320/08/0320/11/0320/02/0420/05/0420/08/0420/11/0420/02/0520/05/0520/08/0520/11/0521/02/06DEXIA’S STOCK MARKET PERFORMANCE IN PARIS AND TRADING VOLUMESEUR 25Monthly trading volume <strong>Dexia</strong> CAC 4090,000,000EUR 20EUR 15EUR 10EUR 5EUR 080,000,00070,000,00060,000,00050,000,00040,000,00030,000,00020,000,00010,000,000020/11/9620/03/9718/07/9715/11/9715/03/9813/07/9810/11/9810/03/9908/07/9905/11/9904/03/0002/07/0030/10/0027/02/0127/06/0125/10/0122/02/0222/06/0220/10/0217/02/0317/06/0315/10/0312/02/0411/06/0409/10/0406/02/0506/06/0504/10/0501/02/0621/02/06DEXIA’S STOCK MARKET PERFORMANCE IN BRUSSELS AND TRADING VOLUMESEUR 25Monthly trading volume<strong>Dexia</strong>BEL2045,000,00040,000,000EUR 2035,000,000EUR 1530,000,00025,000,000EUR 1020,000,00015,000,000EUR 510,000,0005,000,000EUR 0020/11/9620/03/9718/07/9715/11/9715/03/9813/07/9810/11/9810/03/9908/07/9905/11/9904/03/0002/07/0030/10/0027/02/0127/06/0125/10/0122/02/0222/06/0220/10/0217/02/0317/06/0315/10/0312/02/0411/06/0409/10/0406/02/0506/06/0504/10/0501/02/0621/02/0626
<strong>Annual</strong> Report <strong>2005</strong>STOCK EXCHANGE DATABrusselsParisShare price as of December 31, 2004 (in EUR) 16.92 16.93Share price as of December 31, <strong>2005</strong> (in EUR) 19.48 19.49Highest/lowest price (in EUR) 19.78/16.93 19.77/16.93Average daily trading volume (in millions of EUR) 24.33 29.59Number of shares traded daily (in thousands of shares) 1,338 1,628NUMBER OF SHARESAs of As of As of As of As ofDec. 31, 2001 Dec. 31, 2002 Dec. 31, 2003 Dec. 31, 2004 Dec. 31, <strong>2005</strong>Number of shares 1,166,813,164 1,181,685,852 1,175,222,680 1,145,261,366 1,107,469,030Of which Treasury shares 11,867,710 20,082,005 32,546,412 40,050,935 20,550,020Number of options 18,331,214 31,809,349 43,301,416 50,684,800 55,903,030Total number of current/potentialfuture shares (1) 1,185,144,378 1,213,4950201 1,218,524,096 1,195,946,166 1,163,372,060DATA PER SHARE2001 2002 2003 2004 <strong>2005</strong>Earnings per share (in EUR)– basic under <strong>Dexia</strong> GAAP (2) 1.25 1.13 1.24 1.58 –– basic under EU GAAP (2) – – – 1.63 1.87– diluted under EU GAAP (3) – – – 1.62 1.85Average weighted number of shares (4)– basic 1,137,242,884 1,150,867,134 1,157,363,982 1,118,723,767 1,091,316,100– diluted – – – 1,124,050,279 1,103,413,861Net assets per share (in EUR) (5)– under <strong>Dexia</strong> GAAP (6) 8.39 8.79 9.25 9.95 –– related core shareholders’ equity (7) – – –(9)8.87 9.86– related to total shareholders’ equity (8) – – –(9)10.32 12.25Dividend (in EUR)Gross dividend 0.48 0.48 0.53 0.62 0.71 (12)Net dividend (10) 0.36 0.36 0.40 0.47 0.53 (12)Net dividend for shares with a VVPR strip (11) 0.41 0.41 0.45 0.53 0.60 (12)STOCK MARKET RATIOS2001 2002 2003 2004 <strong>2005</strong>Payout ratio (in %) (13)– under <strong>Dexia</strong> GAAP 39.3 43.0 42.1 38.7 –– under EU GAAP – – – 37.6 37.9 (14)Price-earnings ratio (15) 12.9 x 10.4 x 11.0 x 10.7 x 10.4 xPrice to book ratio (16) 1.9 x 1.3 x 1.5 x 1.7 x 2.0 x<strong>Annual</strong> yield (in %) (17) 3.0 4.1 3.9 3.7 3.6(1) For more details refer to “legal information” on www.dexia.<strong>com</strong>.(2) Ratio between the net in<strong>com</strong>e – Group share and the weighted average number of shares.(3) Ratio between the net in<strong>com</strong>e – Group share and the weighted average diluted number of shares.(4) Excluding shares held in treasury stocks.(5) Ratio between the shareholders’ equity (estimated dividend for the period deducted) and the number of shares at the end of the period (after deduction oftreasury shares).(6) Including GBRR – Group share.(7) Without AFS, CFH reserve and cumulative translation adjustments.(8) With AFS, CFH reserve and cumulative translation adjustments.(9) As of January 1, <strong>2005</strong>.(10) After deduction of a 25% Belgian withholding tax.(11) After deduction of a 15% Belgian withholding tax for securities with a VVPR strip.(12) Proposed dividend, the net dividends are rounded up for the purpose of this publication.(13) Ratio between the total dividend and the net in<strong>com</strong>e – Group share.(14) Based on proposed dividend.(15) Ratio between the average share price as of December 31 and the earnings per share for the year.(16) Ratio between the average share price as of December 31 and the net assets per share as of December 31 (related to core shareholders’ equity for <strong>2005</strong>).(17) Ratio between the gross dividend per share and the average share price as of December 31.27