Assam - Ministry of Environment and Forests
Assam - Ministry of Environment and Forests
Assam - Ministry of Environment and Forests

Create successful ePaper yourself
Turn your PDF publications into a flip-book with our unique Google optimized e-Paper software.
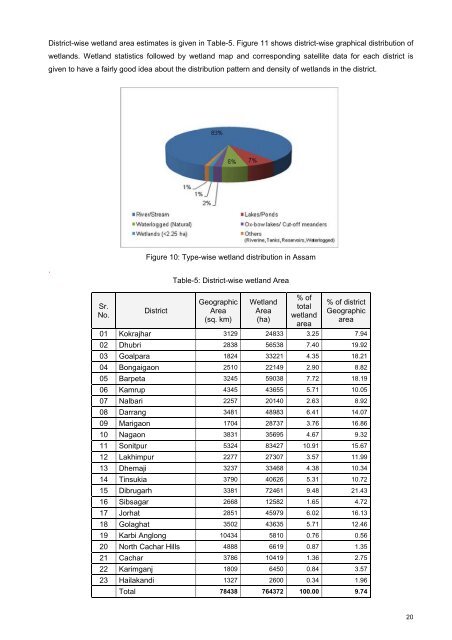
District-wise wetl<strong>and</strong> area estimates is given in Table-5. Figure 11 shows district-wise graphical distribution <strong>of</strong>wetl<strong>and</strong>s. Wetl<strong>and</strong> statistics followed by wetl<strong>and</strong> map <strong>and</strong> corresponding satellite data for each district isgiven to have a fairly good idea about the distribution pattern <strong>and</strong> density <strong>of</strong> wetl<strong>and</strong>s in the district..Figure 10: Type-wise wetl<strong>and</strong> distribution in <strong>Assam</strong>Table-5: District-wise wetl<strong>and</strong> AreaSr.No.DistrictGeographicArea(sq. km)Wetl<strong>and</strong>Area(ha)% <strong>of</strong>totalwetl<strong>and</strong>area% <strong>of</strong> districtGeographicarea01 Kokrajhar 3129 24833 3.25 7.9402 Dhubri 2838 56538 7.40 19.9203 Goalpara 1824 33221 4.35 18.2104 Bongaigaon 2510 22149 2.90 8.8205 Barpeta 3245 59038 7.72 18.1906 Kamrup 4345 43655 5.71 10.0507 Nalbari 2257 20140 2.63 8.9208 Darrang 3481 48983 6.41 14.0709 Marigaon 1704 28737 3.76 16.8610 Nagaon 3831 35695 4.67 9.3211 Sonitpur 5324 83427 10.91 15.6712 Lakhimpur 2277 27307 3.57 11.9913 Dhemaji 3237 33468 4.38 10.3414 Tinsukia 3790 40626 5.31 10.7215 Dibrugarh 3381 72461 9.48 21.4316 Sibsagar 2668 12582 1.65 4.7217 Jorhat 2851 45979 6.02 16.1318 Golaghat 3502 43635 5.71 12.4619 Karbi Anglong 10434 5810 0.76 0.5620 North Cachar Hills 4888 6619 0.87 1.3521 Cachar 3786 10419 1.36 2.7522 Karimganj 1809 6450 0.84 3.5723 Hailak<strong>and</strong>i 1327 2600 0.34 1.96Total 78438 764372 100.00 9.7420