1943 - National Labor Relations Board
1943 - National Labor Relations Board
1943 - National Labor Relations Board
Create successful ePaper yourself
Turn your PDF publications into a flip-book with our unique Google optimized e-Paper software.
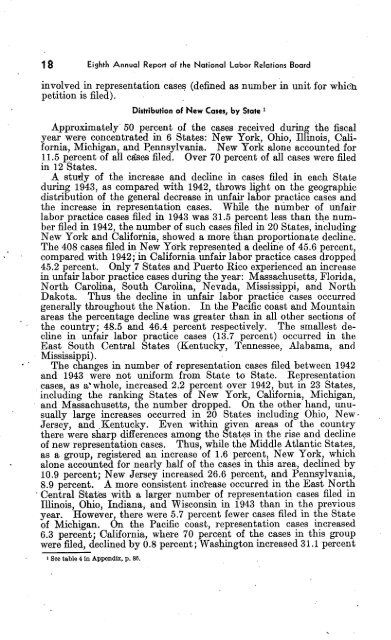
1 8 Eighth Annual Report of the <strong>National</strong> <strong>Labor</strong> <strong>Relations</strong> <strong>Board</strong>involved in representation cases (defined as number in unit for whichpetition is filed).Distribution of New Cases, by State'Approximately 50 percent of the cases received during the fiscalyear were concentrated in 6 States: New York, Ohio, Illinois, California,Michigan, and Pennsylvania. New York alone accounted for11.5 percent of all cases filed. Over 70 percent of all cases were filedin 12 States.A study of the increase and decline in cases filed in each Stateduring <strong>1943</strong>, as compared with 1942, throws light on the geographicdistribution of the general decrease in unfair labor practice cases andthe increase in representation cases. While the numberof unfairlabor practice cases filed in <strong>1943</strong> was 31.5 percent less than the numberfiled in 1942, the number of such cases filed in 20 States, includingNew York and California, showed a more than proportionate decline.The 408 cases filed in New York represented a decline of 45.6 percent,compared with 1942; in California unfair labor practice cases dropped45.2 percent. Only 7 States and Puerto Rico experienced an increasein unfair labor practice cases during the year: Massachusetts, Florida,North Carolina, South Carolina, Nevada, Mississippi, and NorthDakota. Thus the decline in unfair labor practice cases occurredgenerally throughout the Nation. In the Pacific coast and Mountainareas the percentage decline was greater than in all other sections ofthe country; 48.5 and 46.4 percent respectively. The smallest declinein unfair labor practice cases (13.7 percent) occurred in theEast South Central States (Kentucky, Tennessee, Alabama, andMississippi).The changes in number of representation cases filed between 1942and <strong>1943</strong> were not uniform from State to State. Representationcases, as a' whole, increased 2.2 percent over 1942, but in 23 States,including the ranking States of New York, California, Michigan,and Massachusetts, the number dropped. On the other hand, unusuallylarge increases occurred in 20 States including Ohio, New -Jersey, and Kentucky. Even within given areas of the countrythere were sharp differences among the States in the rise and declineof new representation cases. Thus, while the Middle Atlantic States,as a group, registered an increase of 1.6 percent, New York, whichalone accounted for nearly half of the cases in this area, declined by10.9 percent; New Jersey increased 26.6 percent, and Pennsylvania,8.9 percent. A more consistent inciease occurred in the East NorthCentral States with a larger number of representation cases filed inIllinois Ohio, Indiana, and Wisconsin in <strong>1943</strong> than in the previousyear. However, ' there were 5.7 percent fewer cases filed in the Stateof Michigan. aon the Pacific coast, representation cases increased6.3 percent; California, where 70 percent of the cases in this groupwere filed, declined by 0.8 percent; Washington increased 31.1 percentI See table 4 in Appendix, p. 86.


