
Create successful ePaper yourself
Turn your PDF publications into a flip-book with our unique Google optimized e-Paper software.
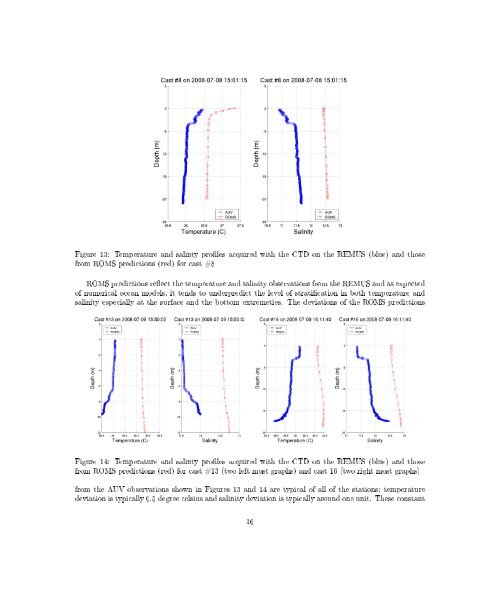
Figure 13: Temperature and salinty proles acquired with the CTD on the REMUS (blue) and thosefrom ROMS predictions (red) for cast #8ROMS predictions reect the temperature and salinity observations from the REMUS and as expectedof numerical ocean models; it tends to underpredict the level of stratication in both temperature andsalinity especially at the surface and the bottom extremeties. The deviations of the ROMS predictionsFigure 14: Temperature and salinty proles acquired with the CTD on the REMUS (blue) and thosefrom ROMS predictions (red) for cast #13 (two left most graphs) and cast 16 (two right most graphs)from the AUV observations shown in Figures 13 and 14 are typical of all of the stations; temperaturedeviation is typically 0.5 degree celsius and salinity deviation is typically around one unit. These constant16