
Create successful ePaper yourself
Turn your PDF publications into a flip-book with our unique Google optimized e-Paper software.
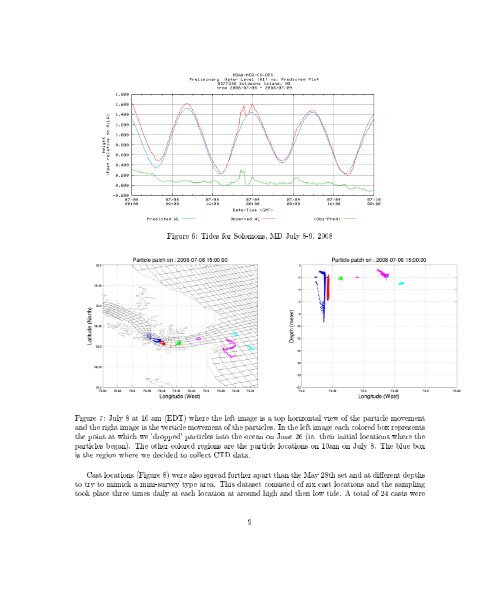
Figure 6: Tides for Solomons, MD July 8-9, 2008Figure 7: July 8 at 10 am (EDT) where the left image is a top horizontal view of the particle movementand the right image is the verticle movement of the particles. In the left image each colored box representsthe point at which we 'dropped' particles into the ocean on June 26 (ie. their initial locations where theparticles began). The other colored regions are the particle locations on 10am on July 8. The blue boxis the region where we decided to collect CTD data.Cast locations (Figure 8) were also spread further apart than the May 28th set and at dierent depthsto try to mimick a mini-survey type area. This dataset consisted of six cast locations and the samplingtook place three times daily at each location at around high and then low tide. A total of 24 casts were9