duration of time for the ow-elds to evolve. The river discharges, tidal water levels and the winds wereramped-up over a 5-day period to enable stable and smooth spin-up (from rest). A quadratic bottomfriction formulation was employed with a drag coecient of 0.005 throughout the model domain. Thebaroclinic time step employed in the computations was 30 seconds.For the particle tracking phase of the simulations, a simplied set-up was sucient, and hence employed,and it involved using constant temperature and salinity throughout the computations with theonly model forcing being provided by tides which is the main driving force behind the movements ofthe water column. The tidal forcing did not include the sub-tidal component which is usually not assignicant as the purely tidal component. This simulation was from June 27, 2008 to July 09, 2008. Thecurrents used for the particle tracking were those of July 08 and July 09 by which time the tidal ow hadfully developed. The particle tracker employed was one developed within CSDL which has a second-orderRunge-Kutta time stepping algorithm. The initial locations of the particles were contained within therectangular boxes shown in Figure 7 (a) and 32 x 32 (1024) regularly spaced were placed within each ofthem. The particles were placed at a vertical depth of 2m below the surface. The locations of the boxescovered the regions of interest for the hydrographic experiments.2.1.2 Hydroid REMUS 100 AUV with SBE 49 FastCAT CTD sensorRegarding the sound speed data, the REMUS had two dierent sensors which were available for use: 1) theYSI and 2) the SBE 49 FastCAT CTD sensor. Both had the ability to acquire conductivity, temperatureand salinity parameters, but only the SBE 49 FastCAT CTD sensor met our data requirements. TheCTD data output by the REMUS gave the SSPs in consecutive order in one text le. In order to beable to use this data operationally, we needed to adjust the algorithm in NOAA's current sound speedprocessing software (Velocwin) to input this data and determine each individual sound speed prole.2.1.3 VelocwinNOAA's Velocwin software was designed as a data management tool to provide various sound speedproducts to NOS. This program allows for the collection of sound speed data from dierent sound speedinstruments, the editing and extending of SSPs, data quality assurance checks, including the ability toassess the impact on acoustic ray paths (ray tracing), and whether the data is consistent with historicalbounds for sound speed (Becker and Grim, 1989).Velocwin is written in Microsoft Visual Basic 6.0 (SP6) and processes sound speed data from a varietyof oceanographic instruments, including Sea-Bird Electronics, Inc. SBE 19/19plus SEACAT, and SBE911plus, Odom's Digibar Pro, BROOKE OCEAN's Moving Vessel Proler (MVP) System, and Sippican'sExpendable Bathythermograph (XBT) System. Velocwin can also accept a manually input sound velocityversus depth input.A new module for processing sound speed data from Sea-Bird Electronics, Inc SBE 49 FastCAT wascreated for the purposes of this project. The module diers in two ways from the other Velocwin processingmodules. First, it must split the SSPs into separate les. This was accomplished by incorporating adowncast detection algorithm into the module. Secondly, the input les are an order of magnitude larger,so much of the original module elements had to be changed from single precision to double precision forprocessing.The CTD test data acquired during routine testing of the REMUS AUV following its return fromreceiving maintenance at the manufacturer's facility in April, was used to create the rst simple testmodule. The CTD le had one downward cast. The AUV began at the surface and descended below thesurface to a depth of preset altitude of 3 meters above the seaoor. In the test area the eective depth of6
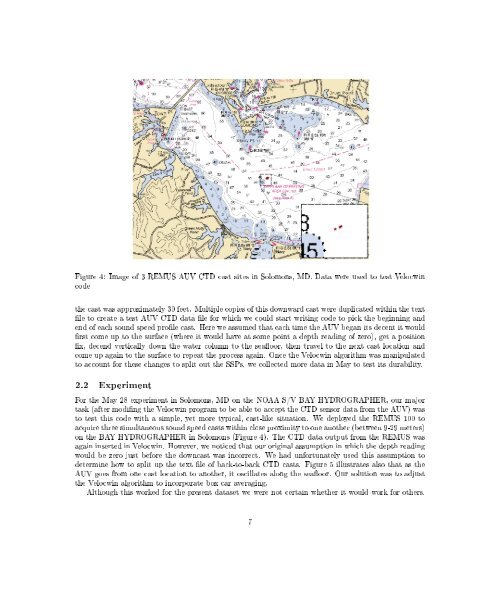
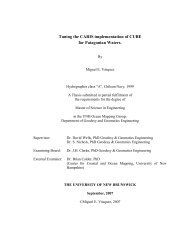
Figure 4: Image of 3 REMUS AUV CTD cast sites in Solomons, MD. Data were used to test Velocwincodethe cast was approximately 30 feet. Multiple copies of this downward cast were duplicated within the textle to create a test AUV CTD data le for which we could start writing code to pick the beginning andend of each sound speed prole cast. Here we assumed that each time the AUV began its decent it wouldrst come up to the surface (where it would have at some point a depth reading of zero), get a positionx, decend vertically down the water column to the seaoor, then travel to the next cast location andcome up again to the surface to repeat the process again. Once the Velocwin algorithm was manipulatedto account for these changes to split out the SSPs, we collected more data in May to test its durability.2.2 ExperimentFor the May 28 experiment in Solomons, MD on the NOAA S/V BAY HYDROGRAPHER, our majortask (after moding the Velocwin program to be able to accept the CTD sensor data from the AUV) wasto test this code with a simple, yet more typical, cast-like situation. We deployed the REMUS 100 toacquire three simultaneous sound speed casts within close proximity to one another (between 9-29 meters)on the BAY HYDROGRAPHER in Solomons (Figure 4). The CTD data output from the REMUS wasagain inserted in Velocwin. However, we noticed that our original assumption in which the depth readingwould be zero just before the downcast was incorrect. We had unfortunately used this assumption todetermine how to split up the text le of back-to-back CTD casts. Figure 5 illustrates also that as theAUV goes from one cast location to another, it oscillates along the seaoor. Our solution was to adjustthe Velocwin algorithm to incorporate box car averaging.Although this worked for the present dataset we were not certain whether it would work for others.7