
Create successful ePaper yourself
Turn your PDF publications into a flip-book with our unique Google optimized e-Paper software.
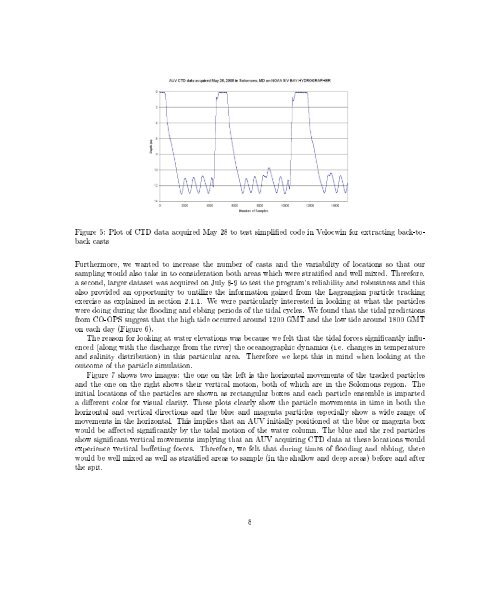
Figure 5: Plot of CTD data acquired May 28 to test simplied code in Velocwin for extracting back-tobackcastsFurthermore, we wanted to increase the number of casts and the variability of locations so that oursampling would also take in to consideration both areas which were stratied and well mixed. Therefore,a second, larger dataset was acquired on July 8-9 to test the program's reliability and robustness and thisalso provided an opportunity to untilize the information gained from the Lagrangian particle trackingexercise as explained in section 2.1.1. We were particularly interested in looking at what the particleswere doing during the ooding and ebbing periods of the tidal cycles. We found that the tidal predictionsfrom CO-OPS suggest that the high tide occurred around 1200 GMT and the low tide around 1800 GMTon each day (Figure 6).The reason for looking at water elevations was because we felt that the tidal forces signicantly inuenced(along with the discharge from the river) the oceanographic dynamics (i.e. changes in temperatureand salinity distribution) in this particular area. Therefore we kept this in mind when looking at theoutcome of the particle simulation.Figure 7 shows two images: the one on the left is the horizontal movements of the tracked particlesand the one on the right shows their vertical motion, both of which are in the Solomons region. Theinitial locations of the particles are shown as rectangular boxes and each particle ensemble is imparteda dierent color for visual clarity. These plots clearly show the particle movements in time in both thehorizontal and vertical directions and the blue and magenta particles especially show a wide range ofmovements in the horizontal. This implies that an AUV initially positioned at the blue or magenta boxwould be aected signicantly by the tidal motion of the water column. The blue and the red particlesshow signicant vertical movements implying that an AUV acquiring CTD data at these locations wouldexperience vertical bueting forces. Therefore, we felt that during times of ooding and ebbing, therewould be well mixed as well as stratied areas to sample (in the shallow and deep areas) before and afterthe spit.8