- Page 2:
Obesity Epidemiology
- Page 6:
Obesity EpidemiologyFrank B. Hu, MD
- Page 10:
To Lisa
- Page 14:
AcknowledgmentsI am deeply indebted
- Page 18:
PrefaceSparked by a surging epidemi
- Page 22:
ContentsList of Invited Contributor
- Page 26:
List of Invited ContributorsGary G.
- Page 30:
Obesity Epidemiology
- Page 34:
Part IStudy Designs andMeasurements
- Page 38:
1Introduction to ObesityEpidemiolog
- Page 42:
Historical Context of Obesity Resea
- Page 46:
INTRODUCTION TO OBESITY EPIDEMIOLOG
- Page 50:
INTRODUCTION TO OBESITY EPIDEMIOLOG
- Page 54:
INTRODUCTION TO OBESITY EPIDEMIOLOG
- Page 58:
2Descriptive Epidemiologyof Obesity
- Page 62:
DESCRIPTIVE EPIDEMIOLOGY OF OBESITY
- Page 66:
DESCRIPTIVE EPIDEMIOLOGY OF OBESITY
- Page 70:
DESCRIPTIVE EPIDEMIOLOGY OF OBESITY
- Page 74:
DESCRIPTIVE EPIDEMIOLOGY OF OBESITY
- Page 78:
DESCRIPTIVE EPIDEMIOLOGY OF OBESITY
- Page 82:
ANALYTIC EPIDEMIOLOGIC DESIGNS IN O
- Page 86:
ANALYTIC EPIDEMIOLOGIC DESIGNS IN O
- Page 90:
ANALYTIC EPIDEMIOLOGIC DESIGNS IN O
- Page 94:
ANALYTIC EPIDEMIOLOGIC DESIGNS IN O
- Page 98:
ANALYTIC EPIDEMIOLOGIC DESIGNS IN O
- Page 102:
ANALYTIC EPIDEMIOLOGIC DESIGNS IN O
- Page 106:
INTERPRETING EPIDEMIOLOGIC EVIDENCE
- Page 110:
INTERPRETING EPIDEMIOLOGIC EVIDENCE
- Page 114: INTERPRETING EPIDEMIOLOGIC EVIDENCE
- Page 118: INTERPRETING EPIDEMIOLOGIC EVIDENCE
- Page 122: INTERPRETING EPIDEMIOLOGIC EVIDENCE
- Page 126: INTERPRETING EPIDEMIOLOGIC EVIDENCE
- Page 130: INTERPRETING EPIDEMIOLOGIC EVIDENCE
- Page 134: 5Measurements of Adiposityand Body
- Page 138: Table 5.1 A Comparison of Commonly
- Page 142: MEASUREMENTS OF ADIPOSITY AND BODY
- Page 146: MEASUREMENTS OF ADIPOSITY AND BODY
- Page 150: MEASUREMENTS OF ADIPOSITY AND BODY
- Page 154: MEASUREMENTS OF ADIPOSITY AND BODY
- Page 158: MEASUREMENTS OF ADIPOSITY AND BODY
- Page 162: MEASUREMENTS OF ADIPOSITY AND BODY
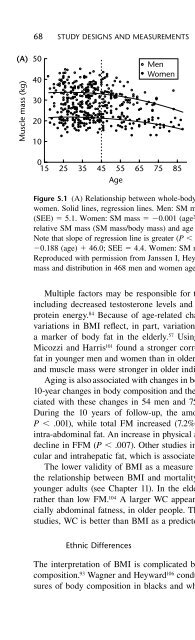
- Page 168: 70 STUDY DESIGNS AND MEASUREMENTSof
- Page 172: 72 STUDY DESIGNS AND MEASUREMENTS(P
- Page 176: 74 STUDY DESIGNS AND MEASUREMENTSha
- Page 180: 76 STUDY DESIGNS AND MEASUREMENTSme
- Page 184: 78 STUDY DESIGNS AND MEASUREMENTS21
- Page 188: 80 STUDY DESIGNS AND MEASUREMENTS63
- Page 192: 82 STUDY DESIGNS AND MEASUREMENTS10
- Page 196: 6Dietary AssessmentMethodsFrank B.
- Page 200: 86 STUDY DESIGNS AND MEASUREMENTSFo
- Page 204: 88 STUDY DESIGNS AND MEASUREMENTSin
- Page 208: 90 STUDY DESIGNS AND MEASUREMENTS24
- Page 212: 92 STUDY DESIGNS AND MEASUREMENTS(C
- Page 216:
94 STUDY DESIGNS AND MEASUREMENTSUr
- Page 220:
96 STUDY DESIGNS AND MEASUREMENTS20
- Page 224:
98 STUDY DESIGNS AND MEASUREMENTSco
- Page 228:
100 STUDY DESIGNS AND MEASUREMENTSI
- Page 232:
102 STUDY DESIGNS AND MEASUREMENTS3
- Page 236:
104 STUDY DESIGNS AND MEASUREMENTSc
- Page 240:
106 STUDY DESIGNS AND MEASUREMENTSC
- Page 244:
108 STUDY DESIGNS AND MEASUREMENTSU
- Page 248:
110 STUDY DESIGNS AND MEASUREMENTSM
- Page 252:
112 STUDY DESIGNS AND MEASUREMENTS8
- Page 256:
114 STUDY DESIGNS AND MEASUREMENTS5
- Page 260:
116 STUDY DESIGNS AND MEASUREMENTS8
- Page 264:
118 STUDY DESIGNS AND MEASUREMENTS1
- Page 268:
120 STUDY DESIGNS AND MEASUREMENTSd
- Page 272:
Table 7.1 Classification of Physica
- Page 276:
Table 7.2 Advantages and Disadvanta
- Page 280:
126 STUDY DESIGNS AND MEASUREMENTSG
- Page 284:
128 STUDY DESIGNS AND MEASUREMENTSa
- Page 288:
130 STUDY DESIGNS AND MEASUREMENTSf
- Page 292:
132 STUDY DESIGNS AND MEASUREMENTSP
- Page 296:
134 STUDY DESIGNS AND MEASUREMENTSV
- Page 300:
136 STUDY DESIGNS AND MEASUREMENTSp
- Page 304:
Table 7.3 Variance Components for T
- Page 308:
140 STUDY DESIGNS AND MEASUREMENTSR
- Page 312:
142 STUDY DESIGNS AND MEASUREMENTS4
- Page 316:
144 STUDY DESIGNS AND MEASUREMENTS8
- Page 320:
This page intentionally left blank
- Page 324:
This page intentionally left blank
- Page 328:
150 EPIDEMIOLOGIC STUDIES OF CONSEQ
- Page 332:
152 EPIDEMIOLOGIC STUDIES OF CONSEQ
- Page 336:
154 EPIDEMIOLOGIC STUDIES OF CONSEQ
- Page 340:
156 EPIDEMIOLOGIC STUDIES OF CONSEQ
- Page 344:
158 EPIDEMIOLOGIC STUDIES OF CONSEQ
- Page 348:
160 EPIDEMIOLOGIC STUDIES OF CONSEQ
- Page 352:
162 EPIDEMIOLOGIC STUDIES OF CONSEQ
- Page 356:
164 EPIDEMIOLOGIC STUDIES OF CONSEQ
- Page 360:
166 EPIDEMIOLOGIC STUDIES OF CONSEQ
- Page 364:
168 EPIDEMIOLOGIC STUDIES OF CONSEQ
- Page 368:
170 EPIDEMIOLOGIC STUDIES OF CONSEQ
- Page 372:
172 EPIDEMIOLOGIC STUDIES OF CONSEQ
- Page 376:
9Obesity and CardiovascularDiseaseF
- Page 380:
Table 9.1 A Summary of Three Meta-a
- Page 384:
178 EPIDEMIOLOGIC STUDIES OF CONSEQ
- Page 388:
180 EPIDEMIOLOGIC STUDIES OF CONSEQ
- Page 392:
182 EPIDEMIOLOGIC STUDIES OF CONSEQ
- Page 396:
Table 9.2 A Summary of Prospective
- Page 400:
186 EPIDEMIOLOGIC STUDIES OF CONSEQ
- Page 404:
188 EPIDEMIOLOGIC STUDIES OF CONSEQ
- Page 408:
190 EPIDEMIOLOGIC STUDIES OF CONSEQ
- Page 412:
192 EPIDEMIOLOGIC STUDIES OF CONSEQ
- Page 416:
194 EPIDEMIOLOGIC STUDIES OF CONSEQ
- Page 420:
10Obesity and CancerEugenia E. Call
- Page 424:
198 EPIDEMIOLOGIC STUDIES OF CONSEQ
- Page 428:
200 EPIDEMIOLOGIC STUDIES OF CONSEQ
- Page 432:
202 EPIDEMIOLOGIC STUDIES OF CONSEQ
- Page 436:
204 EPIDEMIOLOGIC STUDIES OF CONSEQ
- Page 440:
206 EPIDEMIOLOGIC STUDIES OF CONSEQ
- Page 444:
208 EPIDEMIOLOGIC STUDIES OF CONSEQ
- Page 448:
210 EPIDEMIOLOGIC STUDIES OF CONSEQ
- Page 452:
212 EPIDEMIOLOGIC STUDIES OF CONSEQ
- Page 456:
214 EPIDEMIOLOGIC STUDIES OF CONSEQ
- Page 460:
11Obesity and MortalityFrank B. HuT
- Page 464:
218 EPIDEMIOLOGIC STUDIES OF CONSEQ
- Page 468:
220 EPIDEMIOLOGIC STUDIES OF CONSEQ
- Page 472:
222 EPIDEMIOLOGIC STUDIES OF CONSEQ
- Page 476:
224 EPIDEMIOLOGIC STUDIES OF CONSEQ
- Page 480:
226 EPIDEMIOLOGIC STUDIES OF CONSEQ
- Page 484:
228 EPIDEMIOLOGIC STUDIES OF CONSEQ
- Page 488:
230 EPIDEMIOLOGIC STUDIES OF CONSEQ
- Page 492:
232 EPIDEMIOLOGIC STUDIES OF CONSEQ
- Page 496:
12Obesity and Health-RelatedQuality
- Page 500:
236 EPIDEMIOLOGIC STUDIES OF CONSEQ
- Page 504:
238 EPIDEMIOLOGIC STUDIES OF CONSEQ
- Page 508:
Table 12.1 continuedAuthors(Year)Da
- Page 512:
Table 12.1 continuedAuthors(Year)Da
- Page 516:
Table 12.1 continuedAuthors(Year)Da
- Page 520:
Table 12.1 continuedAuthors(Year)Da
- Page 524:
Table 12.2 Studies of Weight Change
- Page 528:
250 EPIDEMIOLOGIC STUDIES OF CONSEQ
- Page 532:
Table 12.3 Studies of Obesity and H
- Page 536:
Table 12.3 continuedAuthors(Year)Da
- Page 540:
256 EPIDEMIOLOGIC STUDIES OF CONSEQ
- Page 544:
258 EPIDEMIOLOGIC STUDIES OF CONSEQ
- Page 548:
260 EPIDEMIOLOGIC STUDIES OF CONSEQ
- Page 552:
262 EPIDEMIOLOGIC STUDIES OF CONSEQ
- Page 556:
264 EPIDEMIOLOGIC STUDIES OF CONSEQ
- Page 560:
266 EPIDEMIOLOGIC STUDIES OF CONSEQ
- Page 564:
268 EPIDEMIOLOGIC STUDIES OF CONSEQ
- Page 568:
270 EPIDEMIOLOGIC STUDIES OF CONSEQ
- Page 572:
This page intentionally left blank
- Page 576:
This page intentionally left blank
- Page 580:
276 EPIDEMIOLOGIC STUDIES OF DETERM
- Page 584:
278 EPIDEMIOLOGIC STUDIES OF DETERM
- Page 588:
280 EPIDEMIOLOGIC STUDIES OF DETERM
- Page 592:
282 EPIDEMIOLOGIC STUDIES OF DETERM
- Page 596:
284 EPIDEMIOLOGIC STUDIES OF DETERM
- Page 600:
286 EPIDEMIOLOGIC STUDIES OF DETERM
- Page 604:
288 EPIDEMIOLOGIC STUDIES OF DETERM
- Page 608:
290 EPIDEMIOLOGIC STUDIES OF DETERM
- Page 612:
292 EPIDEMIOLOGIC STUDIES OF DETERM
- Page 616:
294 EPIDEMIOLOGIC STUDIES OF DETERM
- Page 620:
296 EPIDEMIOLOGIC STUDIES OF DETERM
- Page 624:
298 EPIDEMIOLOGIC STUDIES OF DETERM
- Page 628:
300 EPIDEMIOLOGIC STUDIES OF DETERM
- Page 632:
302 EPIDEMIOLOGIC STUDIES OF DETERM
- Page 636:
304 EPIDEMIOLOGIC STUDIES OF DETERM
- Page 640:
306 EPIDEMIOLOGIC STUDIES OF DETERM
- Page 644:
308 EPIDEMIOLOGIC STUDIES OF DETERM
- Page 648:
310 EPIDEMIOLOGIC STUDIES OF DETERM
- Page 652:
312 EPIDEMIOLOGIC STUDIES OF DETERM
- Page 656:
314 EPIDEMIOLOGIC STUDIES OF DETERM
- Page 660:
316 EPIDEMIOLOGIC STUDIES OF DETERM
- Page 664:
318 EPIDEMIOLOGIC STUDIES OF DETERM
- Page 668:
16Sleep Deprivationand ObesitySanja
- Page 672:
322 EPIDEMIOLOGIC STUDIES OF DETERM
- Page 676:
Table 16.1 continuedAuthor/Year/Cou
- Page 680:
326 EPIDEMIOLOGIC STUDIES OF DETERM
- Page 684:
Table 16.2 continuedAuthor/Year/Cou
- Page 688:
Table 16.2 continuedAuthor YearCoun
- Page 692:
332 EPIDEMIOLOGIC STUDIES OF DETERM
- Page 696:
334 EPIDEMIOLOGIC STUDIES OF DETERM
- Page 700:
336 EPIDEMIOLOGIC STUDIES OF DETERM
- Page 704:
338 EPIDEMIOLOGIC STUDIES OF DETERM
- Page 708:
340 EPIDEMIOLOGIC STUDIES OF DETERM
- Page 712:
17Social Determinants ofObesityGary
- Page 716:
344 EPIDEMIOLOGIC STUDIES OF DETERM
- Page 720:
346 EPIDEMIOLOGIC STUDIES OF DETERM
- Page 724:
348 EPIDEMIOLOGIC STUDIES OF DETERM
- Page 728:
350 EPIDEMIOLOGIC STUDIES OF DETERM
- Page 732:
352 EPIDEMIOLOGIC STUDIES OF DETERM
- Page 736:
354 EPIDEMIOLOGIC STUDIES OF DETERM
- Page 740:
356 EPIDEMIOLOGIC STUDIES OF DETERM
- Page 744:
358 EPIDEMIOLOGIC STUDIES OF DETERM
- Page 748:
360 EPIDEMIOLOGIC STUDIES OF DETERM
- Page 752:
362 EPIDEMIOLOGIC STUDIES OF DETERM
- Page 756:
364 EPIDEMIOLOGIC STUDIES OF DETERM
- Page 760:
366 EPIDEMIOLOGIC STUDIES OF DETERM
- Page 764:
368 EPIDEMIOLOGIC STUDIES OF DETERM
- Page 768:
370 EPIDEMIOLOGIC STUDIES OF DETERM
- Page 772:
372 EPIDEMIOLOGIC STUDIES OF DETERM
- Page 776:
374 EPIDEMIOLOGIC STUDIES OF DETERM
- Page 780:
376 EPIDEMIOLOGIC STUDIES OF DETERM
- Page 784:
378 EPIDEMIOLOGIC STUDIES OF DETERM
- Page 788:
380 EPIDEMIOLOGIC STUDIES OF DETERM
- Page 792:
382 EPIDEMIOLOGIC STUDIES OF DETERM
- Page 796:
Table 18.3 continuedFirst Author(Ye
- Page 800:
Table 18.3 continuedFirst Author(Ye
- Page 804:
388 EPIDEMIOLOGIC STUDIES OF DETERM
- Page 808:
390 EPIDEMIOLOGIC STUDIES OF DETERM
- Page 812:
392 EPIDEMIOLOGIC STUDIES OF DETERM
- Page 816:
394 EPIDEMIOLOGIC STUDIES OF DETERM
- Page 820:
396 EPIDEMIOLOGIC STUDIES OF DETERM
- Page 824:
398 EPIDEMIOLOGIC STUDIES OF DETERM
- Page 828:
400 EPIDEMIOLOGIC STUDIES OF DETERM
- Page 832:
402 EPIDEMIOLOGIC STUDIES OF DETERM
- Page 836:
404 EPIDEMIOLOGIC STUDIES OF DETERM
- Page 840:
406 EPIDEMIOLOGIC STUDIES OF DETERM
- Page 844:
408 EPIDEMIOLOGIC STUDIES OF DETERM
- Page 848:
410 EPIDEMIOLOGIC STUDIES OF DETERM
- Page 852:
412 EPIDEMIOLOGIC STUDIES OF DETERM
- Page 856:
414 EPIDEMIOLOGIC STUDIES OF DETERM
- Page 860:
20Predictors and Consequencesof Chi
- Page 864:
418 EPIDEMIOLOGIC STUDIES OF DETERM
- Page 868:
420 EPIDEMIOLOGIC STUDIES OF DETERM
- Page 872:
422 EPIDEMIOLOGIC STUDIES OF DETERM
- Page 876:
424 EPIDEMIOLOGIC STUDIES OF DETERM
- Page 880:
426 EPIDEMIOLOGIC STUDIES OF DETERM
- Page 884:
428 EPIDEMIOLOGIC STUDIES OF DETERM
- Page 888:
430 EPIDEMIOLOGIC STUDIES OF DETERM
- Page 892:
432 EPIDEMIOLOGIC STUDIES OF DETERM
- Page 896:
434 EPIDEMIOLOGIC STUDIES OF DETERM
- Page 900:
436 EPIDEMIOLOGIC STUDIES OF DETERM
- Page 904:
438 EPIDEMIOLOGIC STUDIES OF DETERM
- Page 908:
440 EPIDEMIOLOGIC STUDIES OF DETERM
- Page 912:
442 EPIDEMIOLOGIC STUDIES OF DETERM
- Page 916:
444 EPIDEMIOLOGIC STUDIES OF DETERM
- Page 920:
Table 21.2 Summary of Meta-Analyses
- Page 924:
448 EPIDEMIOLOGIC STUDIES OF DETERM
- Page 928:
450 EPIDEMIOLOGIC STUDIES OF DETERM
- Page 932:
452 EPIDEMIOLOGIC STUDIES OF DETERM
- Page 936:
454 EPIDEMIOLOGIC STUDIES OF DETERM
- Page 940:
456 EPIDEMIOLOGIC STUDIES OF DETERM
- Page 944:
458 EPIDEMIOLOGIC STUDIES OF DETERM
- Page 948:
460 EPIDEMIOLOGIC STUDIES OF DETERM
- Page 952:
462 EPIDEMIOLOGIC STUDIES OF DETERM
- Page 956:
464 EPIDEMIOLOGIC STUDIES OF DETERM
- Page 960:
466 EPIDEMIOLOGIC STUDIES OF DETERM
- Page 964:
468 EPIDEMIOLOGIC STUDIES OF DETERM
- Page 968:
470 EPIDEMIOLOGIC STUDIES OF DETERM
- Page 972:
472 EPIDEMIOLOGIC STUDIES OF DETERM
- Page 976:
Table 22.5 Intervention Studies of
- Page 980:
Table 22.5 continuedAuthors (Year)
- Page 984:
478 EPIDEMIOLOGIC STUDIES OF DETERM
- Page 988:
480 EPIDEMIOLOGIC STUDIES OF DETERM
- Page 992:
482 EPIDEMIOLOGIC STUDIES OF DETERM
- Page 996:
484 EPIDEMIOLOGIC STUDIES OF DETERM
- Page 1000:
This page intentionally left blank
- Page 1004:
488 INDEXBiomarkers (contd.)of isof
- Page 1008:
490 INDEXDual-energy x-ray absorpti
- Page 1012:
492 INDEXHeywood case, 99High-densi
- Page 1016:
494 INDEXNational Longitudinal Stud
- Page 1020:
496 INDEXResearch Clinics Questionn
- Page 1024:
498 INDEXWestern Electricdietary hi