- Page 2:
Obesity Epidemiology
- Page 6:
Obesity EpidemiologyFrank B. Hu, MD
- Page 10:
To Lisa
- Page 14:
AcknowledgmentsI am deeply indebted
- Page 18:
PrefaceSparked by a surging epidemi
- Page 22:
ContentsList of Invited Contributor
- Page 26:
List of Invited ContributorsGary G.
- Page 30:
Obesity Epidemiology
- Page 34:
Part IStudy Designs andMeasurements
- Page 38:
1Introduction to ObesityEpidemiolog
- Page 42:
Historical Context of Obesity Resea
- Page 46:
INTRODUCTION TO OBESITY EPIDEMIOLOG
- Page 50:
INTRODUCTION TO OBESITY EPIDEMIOLOG
- Page 54:
INTRODUCTION TO OBESITY EPIDEMIOLOG
- Page 58:
2Descriptive Epidemiologyof Obesity
- Page 62:
DESCRIPTIVE EPIDEMIOLOGY OF OBESITY
- Page 66:
DESCRIPTIVE EPIDEMIOLOGY OF OBESITY
- Page 70:
DESCRIPTIVE EPIDEMIOLOGY OF OBESITY
- Page 74:
DESCRIPTIVE EPIDEMIOLOGY OF OBESITY
- Page 78:
DESCRIPTIVE EPIDEMIOLOGY OF OBESITY
- Page 82:
ANALYTIC EPIDEMIOLOGIC DESIGNS IN O
- Page 86:
ANALYTIC EPIDEMIOLOGIC DESIGNS IN O
- Page 90:
ANALYTIC EPIDEMIOLOGIC DESIGNS IN O
- Page 94:
ANALYTIC EPIDEMIOLOGIC DESIGNS IN O
- Page 98:
ANALYTIC EPIDEMIOLOGIC DESIGNS IN O
- Page 102:
ANALYTIC EPIDEMIOLOGIC DESIGNS IN O
- Page 106:
INTERPRETING EPIDEMIOLOGIC EVIDENCE
- Page 110:
INTERPRETING EPIDEMIOLOGIC EVIDENCE
- Page 114:
INTERPRETING EPIDEMIOLOGIC EVIDENCE
- Page 118:
INTERPRETING EPIDEMIOLOGIC EVIDENCE
- Page 122:
INTERPRETING EPIDEMIOLOGIC EVIDENCE
- Page 126:
INTERPRETING EPIDEMIOLOGIC EVIDENCE
- Page 130:
INTERPRETING EPIDEMIOLOGIC EVIDENCE
- Page 134:
5Measurements of Adiposityand Body
- Page 138:
Table 5.1 A Comparison of Commonly
- Page 142:
MEASUREMENTS OF ADIPOSITY AND BODY
- Page 146:
MEASUREMENTS OF ADIPOSITY AND BODY
- Page 150:
MEASUREMENTS OF ADIPOSITY AND BODY
- Page 154:
MEASUREMENTS OF ADIPOSITY AND BODY
- Page 158:
MEASUREMENTS OF ADIPOSITY AND BODY
- Page 162:
MEASUREMENTS OF ADIPOSITY AND BODY
- Page 166:
MEASUREMENTS OF ADIPOSITY AND BODY
- Page 170:
MEASUREMENTS OF ADIPOSITY AND BODY
- Page 174:
MEASUREMENTS OF ADIPOSITY AND BODY
- Page 178:
MEASUREMENTS OF ADIPOSITY AND BODY
- Page 182:
MEASUREMENTS OF ADIPOSITY AND BODY
- Page 186:
MEASUREMENTS OF ADIPOSITY AND BODY
- Page 190:
MEASUREMENTS OF ADIPOSITY AND BODY
- Page 194:
MEASUREMENTS OF ADIPOSITY AND BODY
- Page 198:
DIETARY ASSESSMENT METHODS 8524-Hou
- Page 202:
DIETARY ASSESSMENT METHODS 87studie
- Page 206:
DIETARY ASSESSMENT METHODS 89and ob
- Page 210:
DIETARY ASSESSMENT METHODS 91200Fas
- Page 214:
DIETARY ASSESSMENT METHODS 93The gl
- Page 218:
DIETARY ASSESSMENT METHODS 95Some b
- Page 222:
DIETARY ASSESSMENT METHODS 97Table
- Page 226:
DIETARY ASSESSMENT METHODS 99diet b
- Page 230:
DIETARY ASSESSMENT METHODS 101Table
- Page 234:
DIETARY ASSESSMENT METHODS 103such
- Page 238:
DIETARY ASSESSMENT METHODS 105nutri
- Page 242:
DIETARY ASSESSMENT METHODS 107173 w
- Page 246:
DIETARY ASSESSMENT METHODS 109eithe
- Page 250:
DIETARY ASSESSMENT METHODS 111A rec
- Page 254:
DIETARY ASSESSMENT METHODS 11330. B
- Page 258:
DIETARY ASSESSMENT METHODS 11571. M
- Page 262:
DIETARY ASSESSMENT METHODS 117106.
- Page 266:
7Physical ActivityMeasurementsFrank
- Page 270:
PHYSICAL ACTIVITY MEASUREMENTS 121e
- Page 274:
PHYSICAL ACTIVITY MEASUREMENTS 123M
- Page 278:
• Describes intensity, frequency,
- Page 282:
PHYSICAL ACTIVITY MEASUREMENTS 127c
- Page 286:
PHYSICAL ACTIVITY MEASUREMENTS 129A
- Page 290:
PHYSICAL ACTIVITY MEASUREMENTS 131F
- Page 294:
PHYSICAL ACTIVITY MEASUREMENTS 133a
- Page 298:
PHYSICAL ACTIVITY MEASUREMENTS 135e
- Page 302:
PHYSICAL ACTIVITY MEASUREMENTS 137a
- Page 306:
PHYSICAL ACTIVITY MEASUREMENTS 139a
- Page 310:
PHYSICAL ACTIVITY MEASUREMENTS 1412
- Page 314:
PHYSICAL ACTIVITY MEASUREMENTS 1436
- Page 318:
PHYSICAL ACTIVITY MEASUREMENTS 1451
- Page 322:
Part IIEpidemiologic Studies ofCons
- Page 326:
8Metabolic Consequencesof ObesityFr
- Page 330:
METABOLIC CONSEQUENCES OF OBESITY 1
- Page 334:
METABOLIC CONSEQUENCES OF OBESITY 1
- Page 338:
METABOLIC CONSEQUENCES OF OBESITY 1
- Page 342:
METABOLIC CONSEQUENCES OF OBESITY 1
- Page 346:
METABOLIC CONSEQUENCES OF OBESITY 1
- Page 350:
METABOLIC CONSEQUENCES OF OBESITY 1
- Page 354:
METABOLIC CONSEQUENCES OF OBESITY 1
- Page 358:
METABOLIC CONSEQUENCES OF OBESITY 1
- Page 362:
METABOLIC CONSEQUENCES OF OBESITY 1
- Page 366:
METABOLIC CONSEQUENCES OF OBESITY 1
- Page 370:
METABOLIC CONSEQUENCES OF OBESITY 1
- Page 374:
METABOLIC CONSEQUENCES OF OBESITY 1
- Page 378:
OBESITY AND CARDIOVASCULAR DISEASE
- Page 382:
OBESITY AND CARDIOVASCULAR DISEASE
- Page 386:
OBESITY AND CARDIOVASCULAR DISEASE
- Page 390:
OBESITY AND CARDIOVASCULAR DISEASE
- Page 394:
OBESITY AND CARDIOVASCULAR DISEASE
- Page 398:
Wesselet al. 46Li et al. 7Women’s
- Page 402:
OBESITY AND CARDIOVASCULAR DISEASE
- Page 406:
OBESITY AND CARDIOVASCULAR DISEASE
- Page 410:
OBESITY AND CARDIOVASCULAR DISEASE
- Page 414:
OBESITY AND CARDIOVASCULAR DISEASE
- Page 418:
OBESITY AND CARDIOVASCULAR DISEASE
- Page 422:
Table 10.1 Associations of Obesity
- Page 426:
OBESITY AND CANCER 199endometrial c
- Page 430:
OBESITY AND CANCER 201increasing BM
- Page 434:
OBESITY AND CANCER 203controlled fo
- Page 438:
OBESITY AND CANCER 205Methodologic
- Page 442:
OBESITY AND CANCER 207Control for S
- Page 446:
OBESITY AND CANCER 20924. Sweeney C
- Page 450:
OBESITY AND CANCER 21164. Larsson S
- Page 454:
OBESITY AND CANCER 213vaccination:
- Page 458:
OBESITY AND CANCER 215145. Haydon A
- Page 462:
OBESITY AND MORTALITY 217Table 11.1
- Page 466:
OBESITY AND MORTALITY 219because ov
- Page 470:
OBESITY AND MORTALITY 221Manson et
- Page 474:
(A)(B)Relative risk of deathCancer
- Page 478:
OBESITY AND MORTALITY 225mortality
- Page 482:
OBESITY AND MORTALITY 227of age. Th
- Page 486:
OBESITY AND MORTALITY 229on mortali
- Page 490:
OBESITY AND MORTALITY 231Although m
- Page 494:
OBESITY AND MORTALITY 23339. Folsom
- Page 498:
OBESITY AND HEALTH-RELATED QUALITY
- Page 502:
OBESITY AND HEALTH-RELATED QUALITY
- Page 506:
Table 12.1 Studies of Obesity and H
- Page 510:
Brown Australianet al. Longitudinal
- Page 514:
Damush Health andet al. Retirement(
- Page 518:
Daviglus Chicagoet al. Heart(2003)
- Page 522:
Dinc et al.(2006) 66 ManisaDemograp
- Page 526:
Leon-Munoz et al. (2005) 72 2001-20
- Page 530:
OBESITY AND HEALTH-RELATED QUALITY
- Page 534:
Williams Health of Young(2005) 75 (
- Page 538:
OBESITY AND HEALTH-RELATED QUALITY
- Page 542:
OBESITY AND HEALTH-RELATED QUALITY
- Page 546:
OBESITY AND HEALTH-RELATED QUALITY
- Page 550:
13Economic Costs of ObesityGraham A
- Page 554:
ECONOMIC COSTS OF OBESITY 263compen
- Page 558:
ECONOMIC COSTS OF OBESITY 265(adeno
- Page 562:
ECONOMIC COSTS OF OBESITY 267mortal
- Page 566:
ECONOMIC COSTS OF OBESITY 2696. Cam
- Page 570:
ECONOMIC COSTS OF OBESITY 27154. Ba
- Page 574:
Part IIIEpidemiologic Studiesof Det
- Page 578:
14Diet, Nutrition, and ObesityFrank
- Page 582:
DIET, NUTRITION, AND OBESITY 277In
- Page 586:
DIET, NUTRITION, AND OBESITY 279Sev
- Page 590:
DIET, NUTRITION, AND OBESITY 281dec
- Page 594:
DIET, NUTRITION, AND OBESITY 283A 1
- Page 598:
DIET, NUTRITION, AND OBESITY 285sug
- Page 602:
DIET, NUTRITION, AND OBESITY 287Num
- Page 606:
DIET, NUTRITION, AND OBESITY 289con
- Page 610:
DIET, NUTRITION, AND OBESITY 291sou
- Page 614:
DIET, NUTRITION, AND OBESITY 293Tab
- Page 618:
DIET, NUTRITION, AND OBESITY 29531.
- Page 622:
DIET, NUTRITION, AND OBESITY 29774.
- Page 626:
DIET, NUTRITION, AND OBESITY 299114
- Page 630:
15Physical Activity, SedentaryBehav
- Page 634:
PHYSICAL ACTIVITY, SEDENTARY BEHAVI
- Page 638:
PHYSICAL ACTIVITY, SEDENTARY BEHAVI
- Page 642:
PHYSICAL ACTIVITY, SEDENTARY BEHAVI
- Page 646:
PHYSICAL ACTIVITY, SEDENTARY BEHAVI
- Page 650:
PHYSICAL ACTIVITY, SEDENTARY BEHAVI
- Page 654:
PHYSICAL ACTIVITY, SEDENTARY BEHAVI
- Page 658:
PHYSICAL ACTIVITY, SEDENTARY BEHAVI
- Page 662:
PHYSICAL ACTIVITY, SEDENTARY BEHAVI
- Page 666:
PHYSICAL ACTIVITY, SEDENTARY BEHAVI
- Page 670:
SLEEP DEPRIVATION AND OBESITY 321In
- Page 674:
Table 16.1 Studies of Sleep and Wei
- Page 678:
SLEEP DEPRIVATION AND OBESITY 325Th
- Page 682:
Table 16.2 Studies of Sleep and Wei
- Page 686:
Gangwischet al. (2005) 59USAOhayon
- Page 690:
SLEEP DEPRIVATION AND OBESITY 331or
- Page 694:
SLEEP DEPRIVATION AND OBESITY 333re
- Page 698:
SLEEP DEPRIVATION AND OBESITY 335fr
- Page 702:
SLEEP DEPRIVATION AND OBESITY 337or
- Page 706:
SLEEP DEPRIVATION AND OBESITY 33927
- Page 710:
SLEEP DEPRIVATION AND OBESITY 34175
- Page 714:
SOCIAL DETERMINANTS OF OBESITY 343O
- Page 718:
SOCIAL DETERMINANTS OF OBESITY 345c
- Page 722:
SOCIAL DETERMINANTS OF OBESITY 347F
- Page 726:
SOCIAL DETERMINANTS OF OBESITY 349a
- Page 730:
SOCIAL DETERMINANTS OF OBESITY 351(
- Page 734:
SOCIAL DETERMINANTS OF OBESITY 353g
- Page 738:
SOCIAL DETERMINANTS OF OBESITY 355s
- Page 742: SOCIAL DETERMINANTS OF OBESITY 357W
- Page 746: SOCIAL DETERMINANTS OF OBESITY 359a
- Page 750: SOCIAL DETERMINANTS OF OBESITY 361w
- Page 754: SOCIAL DETERMINANTS OF OBESITY 363l
- Page 758: SOCIAL DETERMINANTS OF OBESITY 365i
- Page 762: SOCIAL DETERMINANTS OF OBESITY 3672
- Page 766: SOCIAL DETERMINANTS OF OBESITY 3697
- Page 770: SOCIAL DETERMINANTS OF OBESITY 3711
- Page 774: SOCIAL DETERMINANTS OF OBESITY 3731
- Page 778: SOCIAL DETERMINANTS OF OBESITY 3752
- Page 782: 18Metabolic and HormonalPredictors
- Page 786: Table 18.2 Prospective Epidemiologi
- Page 790: METABOLIC AND HORMONAL PREDICTORS O
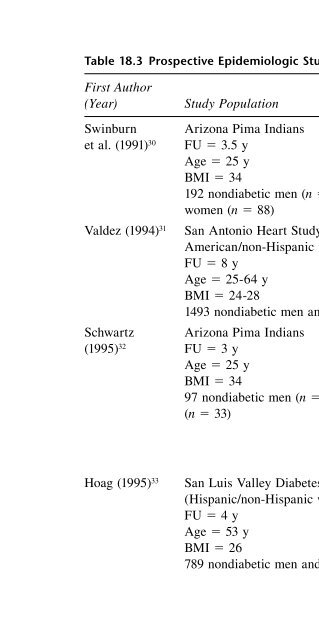
- Page 796: Table 18.3 continuedFirst Author(Ye
- Page 800: Table 18.3 continuedFirst Author(Ye
- Page 804: 388 EPIDEMIOLOGIC STUDIES OF DETERM
- Page 808: 390 EPIDEMIOLOGIC STUDIES OF DETERM
- Page 812: 392 EPIDEMIOLOGIC STUDIES OF DETERM
- Page 816: 394 EPIDEMIOLOGIC STUDIES OF DETERM
- Page 820: 396 EPIDEMIOLOGIC STUDIES OF DETERM
- Page 824: 398 EPIDEMIOLOGIC STUDIES OF DETERM
- Page 828: 400 EPIDEMIOLOGIC STUDIES OF DETERM
- Page 832: 402 EPIDEMIOLOGIC STUDIES OF DETERM
- Page 836: 404 EPIDEMIOLOGIC STUDIES OF DETERM
- Page 840: 406 EPIDEMIOLOGIC STUDIES OF DETERM
- Page 844:
408 EPIDEMIOLOGIC STUDIES OF DETERM
- Page 848:
410 EPIDEMIOLOGIC STUDIES OF DETERM
- Page 852:
412 EPIDEMIOLOGIC STUDIES OF DETERM
- Page 856:
414 EPIDEMIOLOGIC STUDIES OF DETERM
- Page 860:
20Predictors and Consequencesof Chi
- Page 864:
418 EPIDEMIOLOGIC STUDIES OF DETERM
- Page 868:
420 EPIDEMIOLOGIC STUDIES OF DETERM
- Page 872:
422 EPIDEMIOLOGIC STUDIES OF DETERM
- Page 876:
424 EPIDEMIOLOGIC STUDIES OF DETERM
- Page 880:
426 EPIDEMIOLOGIC STUDIES OF DETERM
- Page 884:
428 EPIDEMIOLOGIC STUDIES OF DETERM
- Page 888:
430 EPIDEMIOLOGIC STUDIES OF DETERM
- Page 892:
432 EPIDEMIOLOGIC STUDIES OF DETERM
- Page 896:
434 EPIDEMIOLOGIC STUDIES OF DETERM
- Page 900:
436 EPIDEMIOLOGIC STUDIES OF DETERM
- Page 904:
438 EPIDEMIOLOGIC STUDIES OF DETERM
- Page 908:
440 EPIDEMIOLOGIC STUDIES OF DETERM
- Page 912:
442 EPIDEMIOLOGIC STUDIES OF DETERM
- Page 916:
444 EPIDEMIOLOGIC STUDIES OF DETERM
- Page 920:
Table 21.2 Summary of Meta-Analyses
- Page 924:
448 EPIDEMIOLOGIC STUDIES OF DETERM
- Page 928:
450 EPIDEMIOLOGIC STUDIES OF DETERM
- Page 932:
452 EPIDEMIOLOGIC STUDIES OF DETERM
- Page 936:
454 EPIDEMIOLOGIC STUDIES OF DETERM
- Page 940:
456 EPIDEMIOLOGIC STUDIES OF DETERM
- Page 944:
458 EPIDEMIOLOGIC STUDIES OF DETERM
- Page 948:
460 EPIDEMIOLOGIC STUDIES OF DETERM
- Page 952:
462 EPIDEMIOLOGIC STUDIES OF DETERM
- Page 956:
464 EPIDEMIOLOGIC STUDIES OF DETERM
- Page 960:
466 EPIDEMIOLOGIC STUDIES OF DETERM
- Page 964:
468 EPIDEMIOLOGIC STUDIES OF DETERM
- Page 968:
470 EPIDEMIOLOGIC STUDIES OF DETERM
- Page 972:
472 EPIDEMIOLOGIC STUDIES OF DETERM
- Page 976:
Table 22.5 Intervention Studies of
- Page 980:
Table 22.5 continuedAuthors (Year)
- Page 984:
478 EPIDEMIOLOGIC STUDIES OF DETERM
- Page 988:
480 EPIDEMIOLOGIC STUDIES OF DETERM
- Page 992:
482 EPIDEMIOLOGIC STUDIES OF DETERM
- Page 996:
484 EPIDEMIOLOGIC STUDIES OF DETERM
- Page 1000:
This page intentionally left blank
- Page 1004:
488 INDEXBiomarkers (contd.)of isof
- Page 1008:
490 INDEXDual-energy x-ray absorpti
- Page 1012:
492 INDEXHeywood case, 99High-densi
- Page 1016:
494 INDEXNational Longitudinal Stud
- Page 1020:
496 INDEXResearch Clinics Questionn
- Page 1024:
498 INDEXWestern Electricdietary hi


