
You also want an ePaper? Increase the reach of your titles
YUMPU automatically turns print PDFs into web optimized ePapers that Google loves.
152 Hilpert et al.<br />
than control. Given the large amount of data available, a rigorous methodology<br />
was feasible. We performed a 10-fold stratified, cross-validation where each of<br />
the two sets of peptides were randomly divided into 10 groups, requiring the<br />
number of active peptides in each section to be approximately the same in each<br />
group. By consecutively leaving one group of 10% out for use in validation<br />
and combining the other 9 groups into a single training group, 10 groups were<br />
constructed for training the models. ANNs were constructed using simulation<br />
software (86), by training on each of the 10 training groups and using the leftout<br />
validation group to signal the end of training and preventing overfitting.<br />
(Overfitting occurs when there are too few data for the complexity of the model:<br />
the model tends then to “memorize” the data and while it describes the training<br />
data very well, it performs poorly when used to predict data outside the training<br />
set.)<br />
The performance of any model built on data is best measured by accessing the<br />
predictions of the model in situations that did not exist in the training data. Given<br />
the large amounts of peptide activity data we had available, we chose to assess<br />
the model predictions on the set of data that was not involved in any way in the<br />
construction of the models: we used the Set A models to predict the activity of<br />
Set B peptides, and Set B models to predict activity of Set A peptides. Rather<br />
than attempt to predict IC50, each ANN produced a single number between 0<br />
and 1 to indicate the likelihood that the peptide was more active than Bac2A.<br />
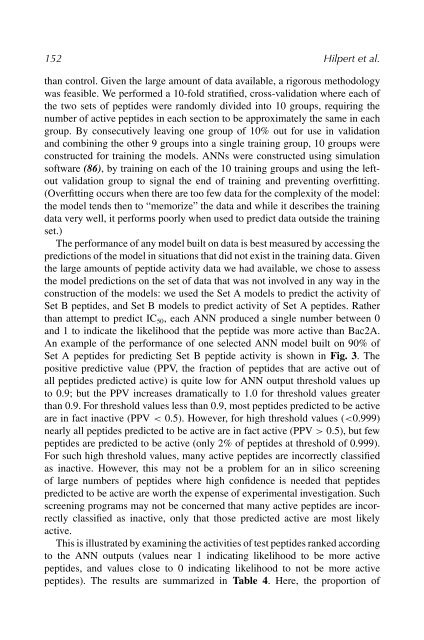
An example of the performance of one selected ANN model built on 90% of<br />
Set A peptides for predicting Set B peptide activity is shown in Fig. 3. The<br />
positive predictive value (PPV, the fraction of peptides that are active out of<br />
all peptides predicted active) is quite low for ANN output threshold values up<br />
to 0.9; but the PPV increases dramatically to 1.0 for threshold values greater<br />
than 0.9. For threshold values less than 0.9, most peptides predicted to be active<br />
are in fact inactive (PPV < 0.5). However, for high threshold values ( 0.5), but few<br />
peptides are predicted to be active (only 2% of peptides at threshold of 0.999).<br />
For such high threshold values, many active peptides are incorrectly classified<br />
as inactive. However, this may not be a problem for an in silico screening<br />
of large numbers of peptides where high confidence is needed that peptides<br />
predicted to be active are worth the expense of experimental investigation. Such<br />
screening programs may not be concerned that many active peptides are incorrectly<br />
classified as inactive, only that those predicted active are most likely<br />
active.<br />
This is illustrated by examining the activities of test peptides ranked according<br />
to the ANN outputs (values near 1 indicating likelihood to be more active<br />
peptides, and values close to 0 indicating likelihood to not be more active<br />
peptides). The results are summarized in Table 4. Here, the proportion of