Vendetta Final Proposal Part 1 (3.4 MB) - Cal Poly
Vendetta Final Proposal Part 1 (3.4 MB) - Cal Poly
Vendetta Final Proposal Part 1 (3.4 MB) - Cal Poly
- No tags were found...

You also want an ePaper? Increase the reach of your titles
YUMPU automatically turns print PDFs into web optimized ePapers that Google loves.
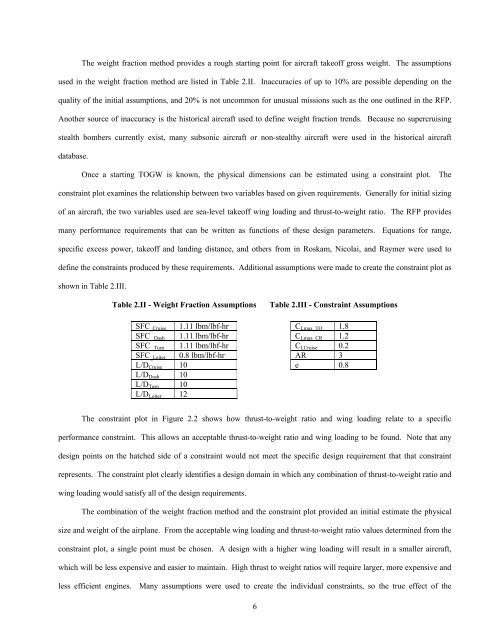
The weight fraction method provides a rough starting point for aircraft takeoff gross weight. The assumptionsused in the weight fraction method are listed in Table 2.II. Inaccuracies of up to 10% are possible depending on thequality of the initial assumptions, and 20% is not uncommon for unusual missions such as the one outlined in the RFP.Another source of inaccuracy is the historical aircraft used to define weight fraction trends. Because no supercruisingstealth bombers currently exist, many subsonic aircraft or non-stealthy aircraft were used in the historical aircraftdatabase.Once a starting TOGW is known, the physical dimensions can be estimated using a constraint plot. Theconstraint plot examines the relationship between two variables based on given requirements. Generally for initial sizingof an aircraft, the two variables used are sea-level takeoff wing loading and thrust-to-weight ratio. The RFP providesmany performance requirements that can be written as functions of these design parameters. Equations for range,specific excess power, takeoff and landing distance, and others from in Roskam, Nicolai, and Raymer were used todefine the constraints produced by these requirements. Additional assumptions were made to create the constraint plot asshown in Table 2.III.Table 2.II - Weight Fraction AssumptionsTable 2.III - Constraint AssumptionsSFC _CruiseSFC _DashSFC _TurnSFC _LoiterL/D Cruise 10L/D Dash 10L/D Turn 10L/D Loiter 121.11 lbm/lbf-hr1.11 lbm/lbf-hr1.11 lbm/lbf-hr0.8 lbm/lbf-hrC Lmax_TO 1.8C Lmax_CR 1.2C LCruise 0.2AR 3e 0.8The constraint plot in Figure 2.2 shows how thrust-to-weight ratio and wing loading relate to a specificperformance constraint. This allows an acceptable thrust-to-weight ratio and wing loading to be found. Note that anydesign points on the hatched side of a constraint would not meet the specific design requirement that that constraintrepresents. The constraint plot clearly identifies a design domain in which any combination of thrust-to-weight ratio andwing loading would satisfy all of the design requirements.The combination of the weight fraction method and the constraint plot provided an initial estimate the physicalsize and weight of the airplane. From the acceptable wing loading and thrust-to-weight ratio values determined from theconstraint plot, a single point must be chosen. A design with a higher wing loading will result in a smaller aircraft,which will be less expensive and easier to maintain. High thrust to weight ratios will require larger, more expensive andless efficient engines. Many assumptions were used to create the individual constraints, so the true effect of the6