Vendetta Final Proposal Part 1 (3.4 MB) - Cal Poly
Vendetta Final Proposal Part 1 (3.4 MB) - Cal Poly
Vendetta Final Proposal Part 1 (3.4 MB) - Cal Poly
- No tags were found...

You also want an ePaper? Increase the reach of your titles
YUMPU automatically turns print PDFs into web optimized ePapers that Google loves.
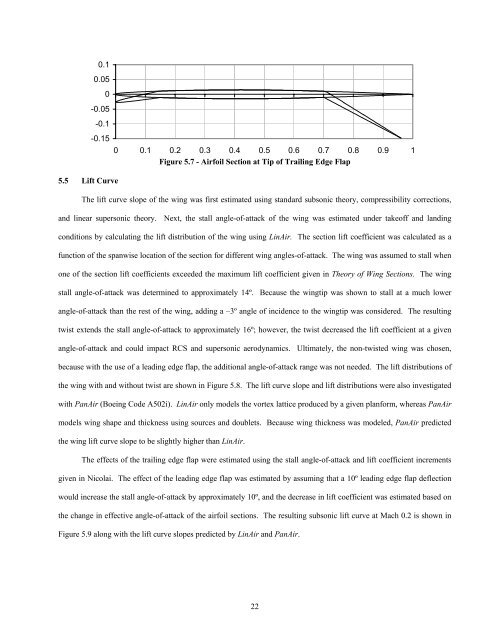
0.10.050-0.05-0.1-0.150 0.1 0.2 0.3 0.4 0.5 0.6 0.7 0.8 0.9 1Figure 5.7 - Airfoil Section at Tip of Trailing Edge Flap5.5 Lift CurveThe lift curve slope of the wing was first estimated using standard subsonic theory, compressibility corrections,and linear supersonic theory. Next, the stall angle-of-attack of the wing was estimated under takeoff and landingconditions by calculating the lift distribution of the wing using LinAir. The section lift coefficient was calculated as afunction of the spanwise location of the section for different wing angles-of-attack. The wing was assumed to stall whenone of the section lift coefficients exceeded the maximum lift coefficient given in Theory of Wing Sections. The wingstall angle-of-attack was determined to approximately 14º. Because the wingtip was shown to stall at a much lowerangle-of-attack than the rest of the wing, adding a –3º angle of incidence to the wingtip was considered. The resultingtwist extends the stall angle-of-attack to approximately 16º; however, the twist decreased the lift coefficient at a givenangle-of-attack and could impact RCS and supersonic aerodynamics. Ultimately, the non-twisted wing was chosen,because with the use of a leading edge flap, the additional angle-of-attack range was not needed. The lift distributions ofthe wing with and without twist are shown in Figure 5.8. The lift curve slope and lift distributions were also investigatedwith PanAir (Boeing Code A502i). LinAir only models the vortex lattice produced by a given planform, whereas PanAirmodels wing shape and thickness using sources and doublets. Because wing thickness was modeled, PanAir predictedthe wing lift curve slope to be slightly higher than LinAir.The effects of the trailing edge flap were estimated using the stall angle-of-attack and lift coefficient incrementsgiven in Nicolai. The effect of the leading edge flap was estimated by assuming that a 10º leading edge flap deflectionwould increase the stall angle-of-attack by approximately 10º, and the decrease in lift coefficient was estimated based onthe change in effective angle-of-attack of the airfoil sections. The resulting subsonic lift curve at Mach 0.2 is shown inFigure 5.9 along with the lift curve slopes predicted by LinAir and PanAir.22