Goal fulfilment in school for the deaf and hearing impaired - batod
Goal fulfilment in school for the deaf and hearing impaired - batod
Goal fulfilment in school for the deaf and hearing impaired - batod
- No tags were found...

You also want an ePaper? Increase the reach of your titles
YUMPU automatically turns print PDFs into web optimized ePapers that Google loves.
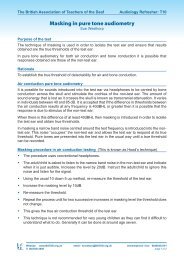
Basis <strong>for</strong> grade comparisonAccord<strong>in</strong>g to <strong>the</strong> Association of Hard of Hear<strong>in</strong>gPeople, <strong>the</strong> target group <strong>in</strong> question consists onaverage of 300 children per year cohort.The collection of data from <strong>the</strong> hear<strong>in</strong>g centresgave an average of approximately 280 children <strong>in</strong>each annual cohort.Statistics Sweden worked on <strong>the</strong> basis of1,313 civic registration numbers <strong>in</strong> <strong>the</strong> groupborn 1986‐1990 <strong>and</strong> retrieved <strong>the</strong>se pupils’f<strong>in</strong>al grades from <strong>the</strong>ir registers. This searchresulted <strong>in</strong> only 911 grades, which can beexpla<strong>in</strong>ed by <strong>the</strong> registers not conta<strong>in</strong><strong>in</strong>g anygrades from special <strong>school</strong> or any details ofassessments from compulsory <strong>school</strong> <strong>for</strong> pupilswith learn<strong>in</strong>g disabilities. Of 911 grades, 110were from different <strong>school</strong>s <strong>for</strong> <strong>the</strong> hear<strong>in</strong>g<strong>impaired</strong> <strong>and</strong> <strong>the</strong>se were removed with <strong>the</strong>help of Statistics Sweden. A total of 801 gradesrema<strong>in</strong>ed, from <strong>in</strong>dividually placed pupils.Special <strong>school</strong>s register f<strong>in</strong>al grades <strong>and</strong>, <strong>for</strong> <strong>the</strong>years 2002‐2006, <strong>the</strong>re were 306 f<strong>in</strong>al gradesfrom <strong>school</strong> year 10. A total of 200 gradeswere reported from <strong>the</strong> <strong>school</strong>s <strong>for</strong> <strong>the</strong> hear<strong>in</strong>g<strong>impaired</strong> <strong>for</strong> <strong>the</strong> same period.Some pupils – 32 <strong>in</strong> all – had a merit rat<strong>in</strong>gof 0. These pupils were not <strong>in</strong>cluded <strong>in</strong> <strong>the</strong>comparison between types of <strong>school</strong>s. Theywere, however, <strong>in</strong>cluded <strong>in</strong> <strong>the</strong> report<strong>in</strong>g of <strong>the</strong>proportion of pupils qualify<strong>in</strong>g <strong>for</strong> a nationalprogramme <strong>and</strong> <strong>the</strong> proportion who achieved<strong>the</strong> goals <strong>in</strong> all subjects.The non-response regard<strong>in</strong>g grades is causedby <strong>the</strong> absence of merit rat<strong>in</strong>gs from Nya BroSchool. Accord<strong>in</strong>g to <strong>in</strong><strong>for</strong>mation from <strong>the</strong>National Agency <strong>for</strong> Education, this <strong>in</strong>volves fivepupils. A certa<strong>in</strong> under-coverage of <strong>in</strong>dividualpupils at <strong>school</strong>s <strong>for</strong> <strong>the</strong> hear<strong>in</strong>g <strong>impaired</strong> canalso occur. The greatest non-response arisesfrom <strong>the</strong> under-report<strong>in</strong>g of civic registrationnumbers from <strong>the</strong> years of birth 1986 <strong>and</strong> 1987.This means that <strong>the</strong> number of grades from<strong>in</strong>dividually placed pupils is on <strong>the</strong> low side <strong>for</strong><strong>the</strong> years 2002 <strong>and</strong> 2003. The under-report<strong>in</strong>gTable 6. Basis <strong>for</strong> results from <strong>school</strong> questionnaire.RowNumber21 Population <strong>for</strong> <strong>school</strong> questionnaire (Row 3) 267222 Non-response <strong>and</strong> overcoverage902*23 No. of1770questionnaires sentout by SCB24 No. who1341responded25 Over-coverage (Upper secondary pupils) 2426 Corrected population (Row 21 – Row 22 – Row 24) 174627 Corrected number of responses (Row 23 - Row 24) 131728 Response75%frequency*** Only 66% of parents sent <strong>in</strong> details of where <strong>the</strong>ir children went to <strong>school</strong>.Thus <strong>the</strong> high non-response rate.** If 1,317 responses from <strong>the</strong> <strong>school</strong>s are divided by 2,476 (Row 18) <strong>the</strong> result is 53%.This is probably <strong>the</strong> correct degree of coverage by <strong>the</strong> <strong>school</strong> questionnaire.<strong>Goal</strong> <strong>fulfilment</strong> <strong>in</strong> <strong>school</strong> <strong>for</strong> <strong>the</strong> <strong>deaf</strong> <strong>and</strong> hear<strong>in</strong>g <strong>impaired</strong>31