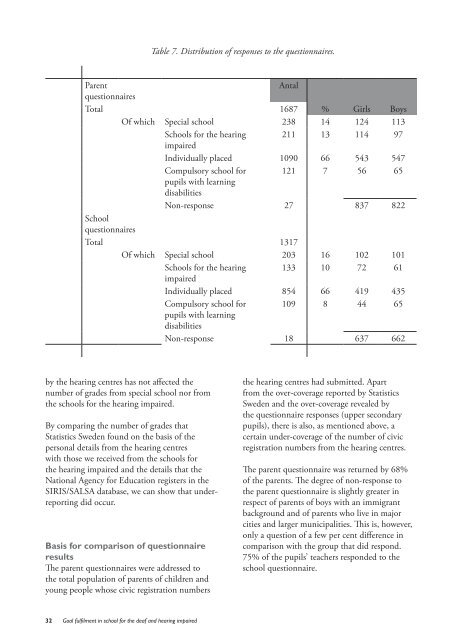
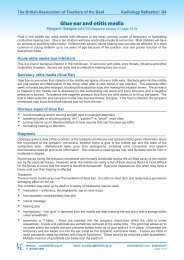
Table 7. Distribution of responses to <strong>the</strong> questionnaires.ParentAntalquestionnairesTotal 1687 % Girls BoysOf which Special <strong>school</strong> 238 14 124 113Schools <strong>for</strong> <strong>the</strong> hear<strong>in</strong>g 211 13 114 97<strong>impaired</strong>Individually placed 1090 66 543 547Compulsory <strong>school</strong> <strong>for</strong> 121 7 56 65pupils with learn<strong>in</strong>gdisabilitiesNon-response 27 837 822SchoolquestionnairesTotal 1317Of which Special <strong>school</strong> 203 16 102 101Schools <strong>for</strong> <strong>the</strong> hear<strong>in</strong>g 133 10 72 61<strong>impaired</strong>Individually placed 854 66 419 435Compulsory <strong>school</strong> <strong>for</strong> 109 8 44 65pupils with learn<strong>in</strong>gdisabilitiesNon-response 18 637 662by <strong>the</strong> hear<strong>in</strong>g centres has not affected <strong>the</strong>number of grades from special <strong>school</strong> nor from<strong>the</strong> <strong>school</strong>s <strong>for</strong> <strong>the</strong> hear<strong>in</strong>g <strong>impaired</strong>.By compar<strong>in</strong>g <strong>the</strong> number of grades thatStatistics Sweden found on <strong>the</strong> basis of <strong>the</strong>personal details from <strong>the</strong> hear<strong>in</strong>g centreswith those we received from <strong>the</strong> <strong>school</strong>s <strong>for</strong><strong>the</strong> hear<strong>in</strong>g <strong>impaired</strong> <strong>and</strong> <strong>the</strong> details that <strong>the</strong>National Agency <strong>for</strong> Education registers <strong>in</strong> <strong>the</strong>SIRIS/SALSA database, we can show that underreport<strong>in</strong>gdid occur.Basis <strong>for</strong> comparison of questionnaireresultsThe parent questionnaires were addressed to<strong>the</strong> total population of parents of children <strong>and</strong>young people whose civic registration numbers<strong>the</strong> hear<strong>in</strong>g centres had submitted. Apartfrom <strong>the</strong> over-coverage reported by StatisticsSweden <strong>and</strong> <strong>the</strong> over-coverage revealed by<strong>the</strong> questionnaire responses (upper secondarypupils), <strong>the</strong>re is also, as mentioned above, acerta<strong>in</strong> under-coverage of <strong>the</strong> number of civicregistration numbers from <strong>the</strong> hear<strong>in</strong>g centres.The parent questionnaire was returned by 68%of <strong>the</strong> parents. The degree of non-response to<strong>the</strong> parent questionnaire is slightly greater <strong>in</strong>respect of parents of boys with an immigrantbackground <strong>and</strong> of parents who live <strong>in</strong> majorcities <strong>and</strong> larger municipalities. This is, however,only a question of a few per cent difference <strong>in</strong>comparison with <strong>the</strong> group that did respond.75% of <strong>the</strong> pupils’ teachers responded to <strong>the</strong><strong>school</strong> questionnaire.32 <strong>Goal</strong> <strong>fulfilment</strong> <strong>in</strong> <strong>school</strong> <strong>for</strong> <strong>the</strong> <strong>deaf</strong> <strong>and</strong> hear<strong>in</strong>g <strong>impaired</strong>
As with o<strong>the</strong>r questionnaire assessments, weprobably have an <strong>in</strong>ternal dropout caused byparents <strong>and</strong> <strong>school</strong>s not recognis<strong>in</strong>g <strong>the</strong>mselves<strong>in</strong> all <strong>the</strong> questions. We wanted to come <strong>in</strong>contact with several different types of hear<strong>in</strong>gloss <strong>in</strong> many different contexts. This resulted <strong>in</strong>a certa<strong>in</strong> number of specifically asked questions<strong>and</strong> <strong>the</strong> questionnaire’s degree of <strong>in</strong>ternal nonresponseto those questions was high. Ga<strong>the</strong>r<strong>in</strong>g<strong>school</strong> addresses from <strong>the</strong> parents <strong>in</strong>volvedan <strong>in</strong>itial non-response of about 30% but <strong>the</strong>procedure was necessary as <strong>the</strong>re is no nationalregister comb<strong>in</strong><strong>in</strong>g both disability <strong>and</strong> <strong>school</strong>.On <strong>the</strong> o<strong>the</strong>r h<strong>and</strong>, ga<strong>the</strong>r<strong>in</strong>g addresses meantthat we could give <strong>the</strong> parents <strong>in</strong><strong>for</strong>mation about<strong>the</strong> assessment at an early stage, thus giv<strong>in</strong>g <strong>the</strong>m<strong>the</strong> opportunity to decide whe<strong>the</strong>r to participate.The result was that we have pupils <strong>for</strong> whom <strong>the</strong>details come from both <strong>the</strong> parent <strong>and</strong> <strong>the</strong> <strong>school</strong>questionnaire, pupils <strong>for</strong> whom <strong>the</strong> details onlycome from <strong>the</strong> parent questionnaire <strong>and</strong> somepupils <strong>for</strong> whom <strong>the</strong> details only come from <strong>the</strong><strong>school</strong> questionnaire.The responses we received were divided by typeof <strong>school</strong>. We <strong>the</strong>n saw that <strong>the</strong> parents of pupils<strong>in</strong> <strong>school</strong>s <strong>for</strong> <strong>the</strong> hear<strong>in</strong>g <strong>impaired</strong> respondedto a slightly greater extent than <strong>the</strong> same pupils’teachers did (see table 7). As regards special<strong>school</strong> <strong>and</strong> <strong>school</strong> <strong>for</strong> pupils with learn<strong>in</strong>gdisabilities, <strong>the</strong> situation was <strong>the</strong> opposite: moreteachers than parents responded. But if we madea comparison with <strong>the</strong> population of pupils <strong>in</strong><strong>school</strong>s <strong>for</strong> <strong>the</strong> hear<strong>in</strong>g <strong>impaired</strong> <strong>and</strong> special<strong>school</strong>s, we saw that <strong>the</strong> degree of response washighest <strong>for</strong> parents of children <strong>in</strong> <strong>school</strong>s <strong>for</strong> <strong>the</strong>hear<strong>in</strong>g <strong>impaired</strong> while it was lowest <strong>for</strong> thosepupils’ teachers (59 <strong>and</strong> 37% respectively). In<strong>the</strong> autumn term, 464 pupils were <strong>in</strong> years 2‐10of special <strong>school</strong> <strong>and</strong> 360 pupils <strong>in</strong> years 2‐9 of<strong>school</strong>s <strong>for</strong> <strong>the</strong> hear<strong>in</strong>g <strong>impaired</strong>.Accord<strong>in</strong>g to <strong>the</strong> Association of Hard of Hear<strong>in</strong>gPeople’s statistics, 68% of <strong>the</strong> pupil group arewhat we call ‘<strong>in</strong>dividually placed’, 17% attendspecial <strong>school</strong> <strong>and</strong> 12% attend <strong>school</strong>s <strong>for</strong> <strong>the</strong>hear<strong>in</strong>g <strong>impaired</strong> (HRF 2007). Bear<strong>in</strong>g <strong>in</strong> m<strong>in</strong>dthat <strong>in</strong> this report we also account <strong>for</strong> <strong>school</strong><strong>for</strong> pupils with learn<strong>in</strong>g disabilities, <strong>and</strong> that<strong>the</strong> Association of Hard of Hear<strong>in</strong>g People <strong>in</strong>its statistics also reports on ano<strong>the</strong>r group ofpupils who attend ma<strong>in</strong>streamed <strong>school</strong>s withan audiotory profile 3 , which constitutes about3%, it can be stated that <strong>the</strong> distribution <strong>in</strong> ourunderly<strong>in</strong>g data reflects <strong>in</strong> general terms <strong>the</strong>situation <strong>for</strong> <strong>deaf</strong> <strong>and</strong> hear<strong>in</strong>g <strong>impaired</strong> pupils<strong>in</strong> <strong>school</strong>. Although, as table 6 shows, we onlyhave a coverage ratio of just over 50% <strong>for</strong> <strong>the</strong><strong>school</strong> questionnaire, we have, on <strong>the</strong> o<strong>the</strong>rh<strong>and</strong>, a distribution between <strong>the</strong> types of <strong>school</strong>sthat co<strong>in</strong>cides with <strong>the</strong> Association of Hard ofHear<strong>in</strong>g People’s statistics.A non-response analysis that <strong>the</strong> SIT conductedshowed that <strong>the</strong> difference between <strong>the</strong>groups – those that responded <strong>and</strong> those thatdid not respond – was less than expected. Theconclusion was that <strong>the</strong> responses received <strong>in</strong><strong>the</strong> survey could, <strong>in</strong> spite of everyth<strong>in</strong>g, beregarded as representative <strong>for</strong> <strong>the</strong> population(Coniavitis Gellerstedt 2007b). But <strong>the</strong>re is stilla risk that non-response of <strong>the</strong> size <strong>in</strong> <strong>the</strong> currentstudy may conta<strong>in</strong> systematic errors. It could,<strong>for</strong> <strong>in</strong>stance, be expected that parents of highersocio-economic status were those who responded(Fortnum, Stacey & Summefield 2006).In our questionnaire, <strong>the</strong> rate of non-responseby parents <strong>and</strong> <strong>school</strong>s can <strong>the</strong>re<strong>for</strong>e be deemedto be too great to allow any confident statementsto be made about <strong>the</strong> whole population. It is, on<strong>the</strong> o<strong>the</strong>r h<strong>and</strong>, possible to make descriptionsof <strong>and</strong> comparisons between those who didrespond.The purpose of <strong>the</strong> questionnaires was to give an<strong>in</strong>-depth picture of <strong>and</strong> provide underly<strong>in</strong>g data<strong>for</strong> analysis of <strong>the</strong> results received <strong>in</strong> <strong>the</strong> gradecomparison. The numerical collection, <strong>in</strong> spite ofnon-response, provided sufficient data <strong>for</strong> this.3Audiotory profile = Schools where <strong>the</strong>y make temporary arrangem,ents <strong>for</strong> hear<strong>in</strong>g imaired pupils. E.g. Sign Language <strong>and</strong>communication classes, encourage hear<strong>in</strong>g <strong>impaired</strong> pupils<strong>Goal</strong> <strong>fulfilment</strong> <strong>in</strong> <strong>school</strong> <strong>for</strong> <strong>the</strong> <strong>deaf</strong> <strong>and</strong> hear<strong>in</strong>g <strong>impaired</strong>33
- Page 2 and 3: This is a translation of main parts
- Page 4 and 5: Goal fulfilment in school for the d
- Page 6 and 7: Table of Contents, contd.Concluding
- Page 8 and 9: Abbreviations and terms 1SPMSVSITTh
- Page 10 and 11: The Swedish Compulsory SchoolCompul
- Page 12 and 13: of teaching in different subjects,
- Page 14 and 15: The SPM has in the report “Pupils
- Page 16 and 17: In addition to the variation in typ
- Page 18 and 19: Attitudes to sign language, long re
- Page 20 and 21: Compulsory school for pupils withle
- Page 22 and 23: In 2007, the SPM reported to the Mi
- Page 24 and 25: impaired pupils’ reading levels i
- Page 26 and 27: Method and implementationMethodPrev
- Page 28 and 29: Figure 1. Flow chart of the collect
- Page 30 and 31: 3,503,002,50Prevalence2,001,501,000
- Page 34 and 35: ResultsTypes of schoolsSchools in S
- Page 36 and 37: 100908070Procent60504030Mild hearin
- Page 38 and 39: the 16 best grades in a pupil’s l
- Page 40 and 41: Table 10. The proportion (%) of pup
- Page 42 and 43: Table 14. Proportion (%) of boys aw
- Page 44 and 45: EnglishThe goals for the learning E
- Page 46 and 47: Table 22. Proportion (%) of pupils
- Page 48 and 49: It is also important to note that t
- Page 50 and 51: Table 26. Proportion (%) in respect
- Page 52 and 53: TeachersParents91878176 76726564Per
- Page 54 and 55: other types have used spoken langua
- Page 56 and 57: On the basis of the assessment resu
- Page 58 and 59: For instance, it can be mentioned t
- Page 60 and 61: Special Schools for the Deaf and Ha
- Page 62 and 63: LiteratureUnpublished sourcesConiav
- Page 64 and 65: Specialskolemyndigheten. . Hämtad
- Page 66 and 67: se>. Välj rubrik “Publikationer
- Page 68 and 69: Appendice I1II. Compulsory School (
- Page 70 and 71: Appendice IVIV. Special school for
- Page 72: The National Agency for Special Nee