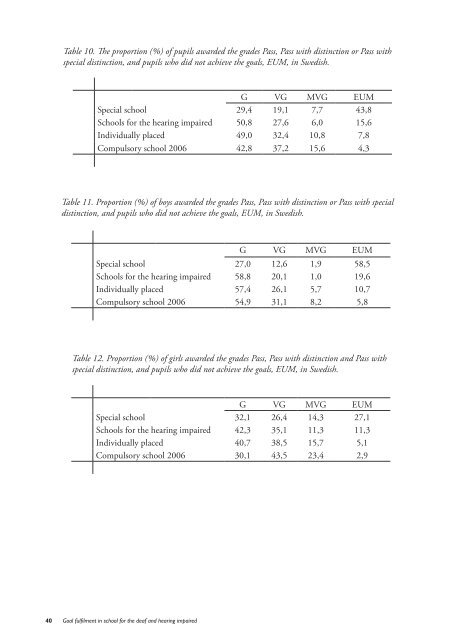
Table 10. The proportion (%) of pupils awarded <strong>the</strong> grades Pass, Pass with dist<strong>in</strong>ction or Pass withspecial dist<strong>in</strong>ction, <strong>and</strong> pupils who did not achieve <strong>the</strong> goals, EUM, <strong>in</strong> Swedish.G VG MVG EUMSpecial <strong>school</strong> 29,4 19,1 7,7 43,8Schools <strong>for</strong> <strong>the</strong> hear<strong>in</strong>g <strong>impaired</strong> 50,8 27,6 6,0 15,6Individually placed 49,0 32,4 10,8 7,8Compulsory <strong>school</strong> 2006 42,8 37,2 15,6 4,3Table 11. Proportion (%) of boys awarded <strong>the</strong> grades Pass, Pass with dist<strong>in</strong>ction or Pass with specialdist<strong>in</strong>ction, <strong>and</strong> pupils who did not achieve <strong>the</strong> goals, EUM, <strong>in</strong> Swedish.G VG MVG EUMSpecial <strong>school</strong> 27,0 12,6 1,9 58,5Schools <strong>for</strong> <strong>the</strong> hear<strong>in</strong>g <strong>impaired</strong> 58,8 20,1 1,0 19,6Individually placed 57,4 26,1 5,7 10,7Compulsory <strong>school</strong> 2006 54,9 31,1 8,2 5,8Table 12. Proportion (%) of girls awarded <strong>the</strong> grades Pass, Pass with dist<strong>in</strong>ction <strong>and</strong> Pass withspecial dist<strong>in</strong>ction, <strong>and</strong> pupils who did not achieve <strong>the</strong> goals, EUM, <strong>in</strong> Swedish.G VG MVG EUMSpecial <strong>school</strong> 32,1 26,4 14,3 27,1Schools <strong>for</strong> <strong>the</strong> hear<strong>in</strong>g <strong>impaired</strong> 42,3 35,1 11,3 11,3Individually placed 40,7 38,5 15,7 5,1Compulsory <strong>school</strong> 2006 30,1 43,5 23,4 2,940 <strong>Goal</strong> <strong>fulfilment</strong> <strong>in</strong> <strong>school</strong> <strong>for</strong> <strong>the</strong> <strong>deaf</strong> <strong>and</strong> hear<strong>in</strong>g <strong>impaired</strong>
Subject gradesThe structure we used <strong>for</strong> present<strong>in</strong>g grades is<strong>the</strong> same as that used by <strong>the</strong> National Agency <strong>for</strong>Education <strong>in</strong> its annual summaries.As shown <strong>in</strong> table 9, it is more difficult <strong>for</strong> <strong>deaf</strong><strong>and</strong> hear<strong>in</strong>g <strong>impaired</strong> pupils to achieve <strong>the</strong> goals<strong>in</strong> comparison with pupils with normal hear<strong>in</strong>g.We have less <strong>in</strong><strong>for</strong>mation, however, aboutpupils’ achievement <strong>in</strong> <strong>in</strong>dividual subjects. Theofficial statistics don’t tell us whe<strong>the</strong>r <strong>the</strong> pupilsattempted a subject <strong>and</strong> failed, or if <strong>the</strong>y didn’ttake this subject. Just less than 20% of <strong>the</strong> pupilsat special <strong>school</strong> have a reduced course of studies.We have no details about reduced courses ofstudies <strong>in</strong> o<strong>the</strong>r types of <strong>school</strong>.In <strong>the</strong> follow<strong>in</strong>g section we present grades<strong>in</strong> Swedish, English, ma<strong>the</strong>matics <strong>and</strong> signlanguage <strong>for</strong> all pupils. As a comparison, we haveused <strong>the</strong> National Agency <strong>for</strong> Education’s annualstatistics from compulsory <strong>school</strong>. Our groupsof ‘<strong>in</strong>dividually placed pupils’ <strong>and</strong> ‘<strong>school</strong>s <strong>for</strong><strong>the</strong> hear<strong>in</strong>g <strong>impaired</strong>’, which comprise justless than 1% of <strong>the</strong> total basis <strong>for</strong> <strong>the</strong> Agency’sstatistics, are <strong>in</strong>cluded <strong>in</strong> our figures as well as <strong>in</strong><strong>the</strong> underly<strong>in</strong>g data <strong>for</strong> children <strong>in</strong> compulsory<strong>school</strong>. Pupils who did not achieve <strong>the</strong> goals <strong>in</strong><strong>the</strong> subjects are presented <strong>in</strong> <strong>the</strong> tables under <strong>the</strong>column EUM.SwedishBelow we present grades <strong>in</strong> <strong>the</strong> subject ofSwedish. None of <strong>the</strong> pupils at special <strong>school</strong>study Swedish as a second language but, <strong>for</strong> <strong>the</strong>purposes of comparison, ‘Swedish as a secondlanguage’ is presented as a part of ‘Swedish’ <strong>for</strong>pupils at <strong>school</strong>s <strong>for</strong> <strong>the</strong> hear<strong>in</strong>g <strong>impaired</strong> <strong>and</strong><strong>in</strong>dividually placed pupils. In our presentation,‘Swedish as a second language’ is also part of‘Swedish’ <strong>in</strong> <strong>the</strong> case of compulsory <strong>school</strong> (seetables 10‐12).The situation <strong>for</strong> Swedish is unique – amongo<strong>the</strong>r th<strong>in</strong>gs, it is one of three subjects that givequalification to progress to upper secondary<strong>school</strong>. Over <strong>the</strong> years, Swedish has been givena great deal of attention <strong>in</strong> special <strong>school</strong>s(Skolöverstyrelsen 1991; Henn<strong>in</strong>g 1995;Henn<strong>in</strong>g 2003). Above all, attempts have beenmade to develop <strong>the</strong> subject <strong>and</strong> <strong>the</strong> tuition on<strong>the</strong> basis of <strong>the</strong> awareness that most <strong>deaf</strong> pupils,while grow<strong>in</strong>g up, do not acquire <strong>the</strong> sameexperience of <strong>the</strong> Swedish language as pupilswith normal hear<strong>in</strong>g. Moreover, many <strong>deaf</strong> <strong>and</strong>hear<strong>in</strong>g <strong>impaired</strong> pupils who come from o<strong>the</strong>rcountries have normally not received any activehabilitation while grow<strong>in</strong>g up <strong>and</strong> <strong>the</strong>y <strong>the</strong>re<strong>for</strong>ecome to <strong>school</strong> nei<strong>the</strong>r with experience of signlanguage nor of written language. Swedish hasthus been regarded periodically as a <strong>for</strong>eignlanguage. For <strong>the</strong>se pupils sign language isregarded as <strong>the</strong>ir first language. The NationalAgency <strong>for</strong> Education has given an explanationof this <strong>in</strong> a common syllabus text. 5 As has alreadybeen mentioned, fewer hours of Swedish arestudied at special <strong>school</strong> than at compulsory<strong>school</strong>.Table 13. Proportion (%) of pupils awarded <strong>the</strong> grades Pass, Pass with dist<strong>in</strong>ction <strong>and</strong> Pass with specialdist<strong>in</strong>ction, <strong>and</strong> pupils who did not achieve <strong>the</strong> goals, EUM, <strong>in</strong> English.G VG MVG EUMSpecial <strong>school</strong> 29,4 12,6 3,8 54,3Schools <strong>for</strong> <strong>the</strong> hear<strong>in</strong>g <strong>impaired</strong> 40,8 25,0 9,7 24,5Individually placed 46,4 30,6 9,9 13,1Compulsory <strong>school</strong> 2006 39,5 37,2 17,3 5,95For more <strong>in</strong><strong>for</strong>mation about <strong>the</strong> common syllabus text, see appendix III.<strong>Goal</strong> <strong>fulfilment</strong> <strong>in</strong> <strong>school</strong> <strong>for</strong> <strong>the</strong> <strong>deaf</strong> <strong>and</strong> hear<strong>in</strong>g <strong>impaired</strong>41
- Page 2 and 3: This is a translation of main parts
- Page 4 and 5: Goal fulfilment in school for the d
- Page 6 and 7: Table of Contents, contd.Concluding
- Page 8 and 9: Abbreviations and terms 1SPMSVSITTh
- Page 10 and 11: The Swedish Compulsory SchoolCompul
- Page 12 and 13: of teaching in different subjects,
- Page 14 and 15: The SPM has in the report “Pupils
- Page 16 and 17: In addition to the variation in typ
- Page 18 and 19: Attitudes to sign language, long re
- Page 20 and 21: Compulsory school for pupils withle
- Page 22 and 23: In 2007, the SPM reported to the Mi
- Page 24 and 25: impaired pupils’ reading levels i
- Page 26 and 27: Method and implementationMethodPrev
- Page 28 and 29: Figure 1. Flow chart of the collect
- Page 30 and 31: 3,503,002,50Prevalence2,001,501,000
- Page 32 and 33: Table 7. Distribution of responses
- Page 34 and 35: ResultsTypes of schoolsSchools in S
- Page 36 and 37: 100908070Procent60504030Mild hearin
- Page 38 and 39: the 16 best grades in a pupil’s l
- Page 42 and 43: Table 14. Proportion (%) of boys aw
- Page 44 and 45: EnglishThe goals for the learning E
- Page 46 and 47: Table 22. Proportion (%) of pupils
- Page 48 and 49: It is also important to note that t
- Page 50 and 51: Table 26. Proportion (%) in respect
- Page 52 and 53: TeachersParents91878176 76726564Per
- Page 54 and 55: other types have used spoken langua
- Page 56 and 57: On the basis of the assessment resu
- Page 58 and 59: For instance, it can be mentioned t
- Page 60 and 61: Special Schools for the Deaf and Ha
- Page 62 and 63: LiteratureUnpublished sourcesConiav
- Page 64 and 65: Specialskolemyndigheten. . Hämtad
- Page 66 and 67: se>. Välj rubrik “Publikationer
- Page 68 and 69: Appendice I1II. Compulsory School (
- Page 70 and 71: Appendice IVIV. Special school for
- Page 72: The National Agency for Special Nee