

The Greenland White-fronted Goose Anser albifrons flavirostris
The Greenland White-fronted Goose Anser albifrons flavirostris
The Greenland White-fronted Goose Anser albifrons flavirostris

You also want an ePaper? Increase the reach of your titles
YUMPU automatically turns print PDFs into web optimized ePapers that Google loves.
the hunting mortality rate K t for year t and plotted<br />
against adult annual return rate R t for that<br />
season. Under the additive mortality hypothesis,<br />
it would be predicted that annual survival rate<br />
(and hence adult return rate) decreases with increasing<br />
kill rate in a linear fashion (away from K<br />
= 1 where the linear relation is a poor approximation,<br />
see Anderson & Burnham 1976). Under<br />
the hypothesis of completely compensatory mortality,<br />
annual return rate would be independent<br />
of variation in kill rate up to a threshold point<br />
where further increases in kill rate must result in<br />
reduced annual survival (Anderson & Burnham<br />
1976). <strong>The</strong>se two states represent extremes, with<br />
the slope b in the equation:<br />
R = R 0 (1-bK) (2)<br />
In this case R represents annual adult return rate<br />
and R 0 represents this measure when no hunting<br />
occurs. <strong>The</strong> slope b would be equal to unity in<br />
complete additive hunting mortality and zero<br />
over the range of realistic hunting kill rates in<br />
complete compensatory hunting mortality. Note<br />
that this analysis only considers compensatory<br />
mortality as this relates to winter hunting kill<br />
since, by definition, the term R 0 includes the hunting<br />
kill, which occurs in Iceland and <strong>Greenland</strong>,<br />
as well as 'natural' mortality. In this analysis, R is<br />
plotted directly against K and a regression model<br />
applied of the form:<br />
R = R 0 -BK (3)<br />
<strong>The</strong> slope B was tested for significant differences<br />
from the predicted b values of 0 (perfect compensation)<br />
and 1/R 0 (completely additive hunting<br />
mortality) using t tests.<br />
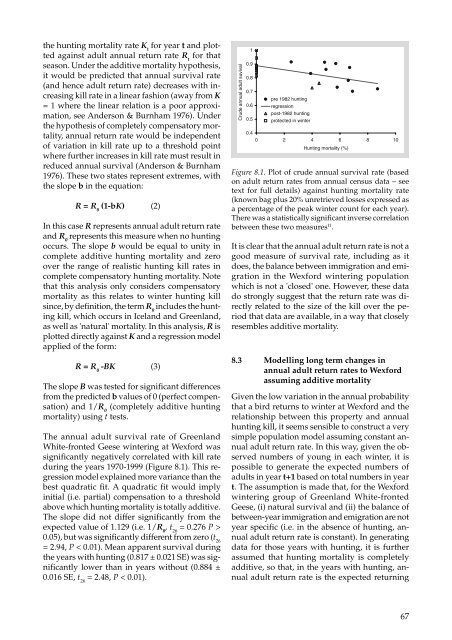
<strong>The</strong> annual adult survival rate of <strong>Greenland</strong><br />
<strong>White</strong>-<strong>fronted</strong> Geese wintering at Wexford was<br />
significantly negatively correlated with kill rate<br />
during the years 1970-1999 (Figure 8.1). This regression<br />
model explained more variance than the<br />
best quadratic fit. A quadratic fit would imply<br />
initial (i.e. partial) compensation to a threshold<br />
above which hunting mortality is totally additive.<br />
<strong>The</strong> slope did not differ significantly from the<br />
expected value of 1.129 (i.e. 1/R 0 , t 26 = 0.276 P ><br />
0.05), but was significantly different from zero (t 26<br />
= 2.94, P < 0.01). Mean apparent survival during<br />
the years with hunting (0.817 ± 0.021 SE) was significantly<br />
lower than in years without (0.884 ±<br />
0.016 SE, t 26 = 2.48, P < 0.01).<br />
Crude annual adult suvival<br />
1<br />
0.9<br />
0.8<br />
0.7<br />
0.6<br />
0.5<br />
pre 1982 hunting<br />
regression<br />
post-1982 hunting<br />
protected in winter<br />
0.4<br />
0 2 4 6 8 10<br />
Hunting mortality (%)<br />
Figure 8.1. Plot of crude annual survival rate (based<br />
on adult return rates from annual census data – see<br />
text for full details) against hunting mortality rate<br />
(known bag plus 20% unretrieved losses expressed as<br />
a percentage of the peak winter count for each year).<br />
<strong>The</strong>re was a statistically significant inverse correlation<br />
between these two measures 11 .<br />
It is clear that the annual adult return rate is not a<br />
good measure of survival rate, including as it<br />
does, the balance between immigration and emigration<br />
in the Wexford wintering population<br />
which is not a 'closed' one. However, these data<br />
do strongly suggest that the return rate was directly<br />
related to the size of the kill over the period<br />
that data are available, in a way that closely<br />
resembles additive mortality.<br />
8.3 Modelling long term changes in<br />
annual adult return rates to Wexford<br />
assuming additive mortality<br />
Given the low variation in the annual probability<br />
that a bird returns to winter at Wexford and the<br />
relationship between this property and annual<br />
hunting kill, it seems sensible to construct a very<br />
simple population model assuming constant annual<br />
adult return rate. In this way, given the observed<br />
numbers of young in each winter, it is<br />
possible to generate the expected numbers of<br />
adults in year t+1 based on total numbers in year<br />
t. <strong>The</strong> assumption is made that, for the Wexford<br />
wintering group of <strong>Greenland</strong> <strong>White</strong>-<strong>fronted</strong><br />
Geese, (i) natural survival and (ii) the balance of<br />
between-year immigration and emigration are not<br />
year specific (i.e. in the absence of hunting, annual<br />
adult return rate is constant). In generating<br />
data for those years with hunting, it is further<br />
assumed that hunting mortality is completely<br />
additive, so that, in the years with hunting, annual<br />
adult return rate is the expected returning<br />
67