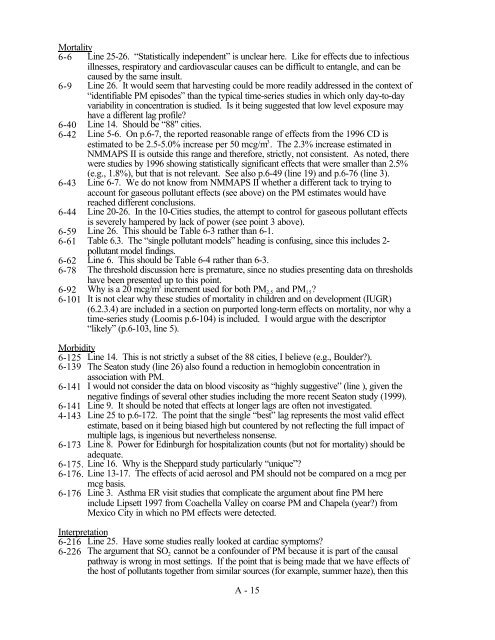
Mortality6-6 Line 25-26. “Statistically independent” is unclear here. Like <strong>for</strong> effects due to infectiousillnesses, respiratory and cardiovascular causes can be difficult to entangle, and can becaused by <strong>the</strong> same insult.6-9 Line 26. It would seem that harvesting could be more readily addressed in <strong>the</strong> context <strong>of</strong>“identifiable PM episodes” than <strong>the</strong> typical time-series studies in which only day-to-dayvariability in concentration is studied. Is it being suggested that low level exposure mayhave a different lag pr<strong>of</strong>ile?6-40 Line 14. Should be “88" cities.6-42 Line 5-6. On p.6-7, <strong>the</strong> reported reasonable range <strong>of</strong> effects from <strong>the</strong> 1996 CD isestimated to be 2.5-5.0% increase per 50 mcg/m 3 . The 2.3% increase estimated inNMMAPS II is outside this range and <strong>the</strong>re<strong>for</strong>e, strictly, not consistent. As noted, <strong>the</strong>rewere studies by 1996 showing statistically significant effects that were smaller than 2.5%(e.g., 1.8%), but that is not relevant. See also p.6-49 (line 19) and p.6-76 (line 3).6-43 Line 6-7. We do not know from NMMAPS II whe<strong>the</strong>r a different tack to trying toaccount <strong>for</strong> gaseous pollutant effects (see above) on <strong>the</strong> PM estimates would havereached different conclusions.6-44 Line 20-26. In <strong>the</strong> 10-Cities studies, <strong>the</strong> attempt to control <strong>for</strong> gaseous pollutant effectsis severely hampered by lack <strong>of</strong> power (see point 3 above).6-59 Line 26. This should be Table 6-3 ra<strong>the</strong>r than 6-1.6-61 Table 6.3. The “single pollutant models” heading is confusing, since this includes 2-pollutant model findings.6-62 Line 6. This should be Table 6-4 ra<strong>the</strong>r than 6-3.6-78 The threshold discussion here is premature, since no studies presenting data on thresholdshave been presented up to this point.6-92 Why is a 20 mcg/m 3 increment used <strong>for</strong> both PM 2.5 and PM 15 ?6-101 It is not clear why <strong>the</strong>se studies <strong>of</strong> mortality in children and on development (IUGR)(6.2.3.4) are included in a section on purported long-term effects on mortality, nor why atime-series study (Loomis p.6-104) is included. I would argue with <strong>the</strong> descriptor“likely” (p.6-103, line 5).Morbidity6-125 Line 14. This is not strictly a subset <strong>of</strong> <strong>the</strong> 88 cities, I believe (e.g., Boulder?).6-139 The Seaton study (line 26) also found a reduction in hemoglobin concentration inassociation with PM.6-141 I would not consider <strong>the</strong> data on blood viscosity as “highly suggestive” (line ), given <strong>the</strong>negative findings <strong>of</strong> several o<strong>the</strong>r studies including <strong>the</strong> more recent Seaton study (1999).6-141 Line 9. It should be noted that effects at longer lags are <strong>of</strong>ten not investigated.4-143 Line 25 to p.6-172. The point that <strong>the</strong> single “best” lag represents <strong>the</strong> most valid effectestimate, based on it being biased high but countered by not reflecting <strong>the</strong> full impact <strong>of</strong>multiple lags, is ingenious but never<strong>the</strong>less nonsense.6-173 Line 8. Power <strong>for</strong> Edinburgh <strong>for</strong> hospitalization counts (but not <strong>for</strong> mortality) should beadequate.6-175. Line 16. Why is <strong>the</strong> Sheppard study particularly “unique”?6-176. Line 13-17. The effects <strong>of</strong> acid aerosol and PM should not be compared on a mcg permcg basis.6-176 Line 3. Asthma ER visit studies that complicate <strong>the</strong> argument about fine PM hereinclude Lipsett 1997 from Coachella Valley on coarse PM and Chapela (year?) fromMexico City in which no PM effects were detected.Interpretation6-216 Line 25. Have some studies really looked at cardiac symptoms?6-226 The argument that SO 2 cannot be a confounder <strong>of</strong> PM because it is part <strong>of</strong> <strong>the</strong> causalpathway is wrong in most settings. If <strong>the</strong> point that is being made that we have effects <strong>of</strong><strong>the</strong> host <strong>of</strong> pollutants toge<strong>the</strong>r from similar sources (<strong>for</strong> example, summer haze), <strong>the</strong>n thisA - 15
is OK. But in most settings it still makes sense to speak <strong>of</strong> effects being due to PM orSO 2 .6-238 Line 26-27. The “best” lag approach again.6-256 The case-crossover study is first introduced here, but should be included in <strong>the</strong>intoduction to study designs on p.6-3.6-258 Line 27. I think “mortality” should be “morbidity”.6-266 Line 17. This is a misuse <strong>of</strong> “strong” in this setting. These are all weak associations.The associations may be consistent, coherent, and have large public health impacts, but<strong>the</strong>y are never<strong>the</strong>less relatively weak associations.Chapter 8. Toxicology.In general, this chapter does an excellent job <strong>of</strong> presenting a great deal <strong>of</strong> new, and <strong>of</strong>tenapparently conflicting, data. The summaries, especially <strong>the</strong> final summary, is well-reasoned andbalanced, and makes conclusions with appropriate qualifiers.As noted below, one important purpose <strong>of</strong> <strong>the</strong> toxicological work is to enhance <strong>the</strong>plausibility <strong>of</strong> <strong>the</strong> epidemiological findings. Much <strong>of</strong> <strong>the</strong> work done using easily studiedparticles such as ROFA, and work using extremely high concentrations <strong>of</strong> particles, althougharguably useful when negative findings are obtained, are less relevant when attempting tointerpret positive findings. This strongly motivates <strong>the</strong> use <strong>of</strong> CAPs studies where real-worldparticles are used. It is argued that because <strong>of</strong> day-to-day variability in <strong>the</strong> particle composition<strong>of</strong> CAPs, that experimental studies will not have <strong>the</strong> statistical power to use a factor analysis tosuccessfully identify <strong>the</strong> components <strong>of</strong> CAPs that are particularly toxic. If valid, this wouldlimit <strong>the</strong> usefulness <strong>of</strong> CAPS. However, recent work by Koutrakis’s group (EHP 2000, seecomments by Koutrakis on this chapter) in which factor analysis was successfully used <strong>for</strong> thispurpose suggests that this is not <strong>the</strong> case. Although <strong>the</strong> findings from <strong>the</strong> multitude <strong>of</strong>toxicological studies are difficult to interpret, <strong>the</strong>y have contributed to enhancing <strong>the</strong> plausibility<strong>of</strong> <strong>the</strong> epidemiological findings. It is anticipated, especially with fur<strong>the</strong>r work using CAPs, that<strong>the</strong> picture will become clearer as work progresses.Introduction8-3 I like <strong>the</strong> notion <strong>of</strong> enhancing biological plausibility, ra<strong>the</strong>r than assessing dose-response,at this stage.Respiratory effects8-20 The paragraphs beginning on line 11, as well as those on 8-37 and 8-43, present usefulperspectives on ROFA. The later discussion on <strong>the</strong> differences between trachealinstillation and inhalational exposures is also helpful.Systemic effects8-31 Line 27. Why does an increase in t-alternans suggest an anti-arrhythmic effect <strong>of</strong> PM?8-34 This summary in para 1 is excellent.Compromised8-41 What is <strong>the</strong> paragraph starting on line18 doing here? There seems little place <strong>for</strong> <strong>the</strong>reference to <strong>the</strong> Nel paper, since <strong>the</strong> statement attributed to it (<strong>the</strong> increase in allergicrhinitis being due to diesel exhaust) is pure conjecture, unless it serves as a starting pointto present findings to support or refute it, which it does not.8-43 The paragraph starting on line16 on <strong>the</strong> Goldsmith paper is repetition <strong>of</strong> a previousparagraph on 8-37.Mechanisms8-65 Line 28. Need to justify <strong>the</strong> significance <strong>of</strong> alkaline phosphatase production, particularlysince it seems, based on <strong>the</strong> preceding sentences, that silicon dioxide was potent.8-68 The section on ultrafines beginning here presents an artificial motivation <strong>for</strong> interest inultrafines. Yes, surface area will increase dramatically as particle size decreases, <strong>for</strong> aA - 16
- Page 5: known, the potential causes deserve
- Page 10: SCIENCE ADVISORY BOARD STAFFMr. A.
- Page 13 and 14: Page 2-77, line 19-22: Should menti
- Page 15 and 16: Page 8-1, lines 26-28: Combustion a
- Page 17 and 18: mode vs. the other. In fact, such k
- Page 19 and 20: p. 7-49, l. 20 In an effort to make
- Page 21 and 22: ambient PM effects. The paragraph d
- Page 23 and 24: dominant, one criticism is that “
- Page 25: 6. Susceptible sub-populationsIt is
- Page 29 and 30: 2. There are repetitions of the sam
- Page 31 and 32: 15. Page 3-57 and 3-58, line 29-31
- Page 33 and 34: P 7- 27, L 15: What does “compara
- Page 35 and 36: there is pertains almost solely to
- Page 37 and 38: studies, and is presented as observ
- Page 39 and 40: P 8-47, L 23-27: These two sentence
- Page 41 and 42: also be summarized. Second, the cha
- Page 43 and 44: P 9-76, L 30: It should be “these
- Page 45 and 46: 4. Page 4-7,lines 14-18. Similar th
- Page 47 and 48: control when it may be possible to
- Page 49 and 50: 1990. Reference Lioy, P.J. “The A
- Page 51 and 52: document.P. 5-82, Lines 15-30 Need
- Page 53 and 54: 7-12 8 insert "that are either very
- Page 55 and 56: 8-62 10,11 The preceding discussion
- Page 57 and 58: 9-27 17 insert "source and/or" afte
- Page 59 and 60: 2. The paper by Künzli et al. on t
- Page 61 and 62: 6-243 12 This section (6.4.4.) shou
- Page 63 and 64: Chapter 5. Human Exposure to PM and
- Page 65 and 66: the chapter. Many of the poor quali
- Page 67 and 68: Page 5-17, equation 5-10; the coeff
- Page 69 and 70: illustrated using a figure from Kel
- Page 71 and 72: tied back to the base-line health s
- Page 73 and 74: Page 7-4, Structure of the Respirat
- Page 75 and 76: Günter Oberdörster, PhDChapter 7
- Page 77 and 78:
efficiencies as well as the ratio o
- Page 79 and 80:
The title of this section is also s
- Page 81 and 82:
old and young rats and mice used on
- Page 83 and 84:
passive use values as opposed to us
- Page 85 and 86:
Specific Comments:Page 5-19, lines
- Page 87 and 88:
Chapter 9 - General CommentsThis ch
- Page 89 and 90:
George Taylor, PhDAir Quality Crite
- Page 91 and 92:
atmospheric stressors associated wi
- Page 93 and 94:
“At the surface, a variable fract
- Page 95 and 96:
that point from this review! “Vis
- Page 97 and 98:
6. P 2-86, section 2.2.5.1 - A shor


