Wexler, A.S., Lurmann, F.W. and Seinfeld, J.H. Modeling urban and regional aerosols: I. Modeldevelopment. Atmos. Environ., 28, 531-546, 1994.Chapter 5 - General:1. The chapter on exposures is a vast improvement over <strong>the</strong> previous version.2. The chapter provides a reasonable summary <strong>of</strong> all recent studies on exposure, andinterpretative analyses <strong>of</strong> previous work.3. Un<strong>for</strong>tunately in <strong>the</strong> attempt to be current, <strong>the</strong> authors have <strong>for</strong>gotten to put some majorconcepts and results into a historical context. Some <strong>of</strong> <strong>the</strong> recent studies look as if <strong>the</strong>y arepresenting <strong>the</strong> first set <strong>of</strong> results on a particular issue. They clearly build upon previousresearch. This should be acknowledged by referring to previous criteria document (AQCD,1996) <strong>for</strong> fur<strong>the</strong>r in<strong>for</strong>mation on specific concepts.4. There is still an over-emphasis on correlations. I have stated be<strong>for</strong>e, an “association(correlation) makes <strong>the</strong> poison” is not a valid concept. Every particle that deposits in <strong>the</strong> lungbecomes part <strong>of</strong> a dose delivered to <strong>the</strong> individual. Although <strong>the</strong> variability is very relevant toresults obtained in many epidemiological studies that support PM health effects, no one has yetshown that a constant or “quasi-constant” baseline level <strong>of</strong> PM from indoor or personal sourcesis irrelevant in causing health effects. This point is mentioned in <strong>the</strong> integration chapter (9), butnot in chapter 5. The variable portion may provide <strong>the</strong> final stress to individuals who has hadsustained contact and deposition <strong>of</strong> particles from all sources. So, both E ag and E ig may havepartial influence on <strong>the</strong> ultimate dose affecting an individual at risk <strong>for</strong> one or more diseaseendpoints, especially potential acute effects.5. The chapter needs ano<strong>the</strong>r E descriptor, E ov-rxn-iv or E (ioRn) . This is PM exposure derived fromoutdoor vapor (ov) reacting (rxn) with indoor vapors (iv). This is a source that could also varywith outdoor PM when <strong>the</strong> (ov) is ozone.6. The range and distribution <strong>of</strong> many variables that affect PM penetration and deposition arenicely presented in <strong>the</strong> discussion. However, <strong>the</strong>se are never integrated and placed into a finalcontext <strong>for</strong> <strong>the</strong> uncertainties about <strong>the</strong> conclusions. The entire discussion is still attempting tosteer us to a mean value <strong>for</strong> exposure used in epidemiological studies, a point that is wellestablished. Un<strong>for</strong>tunately, <strong>the</strong> current approach ignores <strong>the</strong> distributional aspects <strong>of</strong> exposure tooutdoor and o<strong>the</strong>r sources. It precludes fur<strong>the</strong>r ef<strong>for</strong>ts in <strong>the</strong> staff paper to mention <strong>the</strong>uncertainties about <strong>the</strong> dose <strong>of</strong> specific agents or <strong>the</strong> entire mixture <strong>of</strong> PM from indoor andoutdoor air, which could be relevant to acute or chronic outcomes. It precludes any discussion in<strong>the</strong> staff paper on <strong>the</strong> variety <strong>of</strong> exposures and sources, which may cause health effects. I do notbelieve <strong>the</strong> major ion contributing to <strong>the</strong> mean PM (e.g., SO 4-2) is necessarily <strong>the</strong> chemical <strong>of</strong>concern. It may be an indicator, but we still need to define what it is an indicator <strong>of</strong> -- ambientPM 2.5 mass or toxic sub-fractions.7. Last conclusion is a working hypo<strong>the</strong>sis, but it is not <strong>the</strong> sole reason <strong>for</strong> understandingexposure. We need to eventually determine which dose or doses contribute to acute or chroniceffects. The statement needs to be modified accordingly.Detailed Comments:P. 5.6, Table 5.1 Very good summary.P. 5.7, Line 6 We have no definitive “outer limit” it is still a guess, and/or convenientlocation on <strong>the</strong> person. It is usually found somewhere within <strong>the</strong> personalenvelop <strong>for</strong> inhalation.P. 5.8, Line 21 Integral referenced to, NRC 1991. It was published previously by Lioy,A - 37
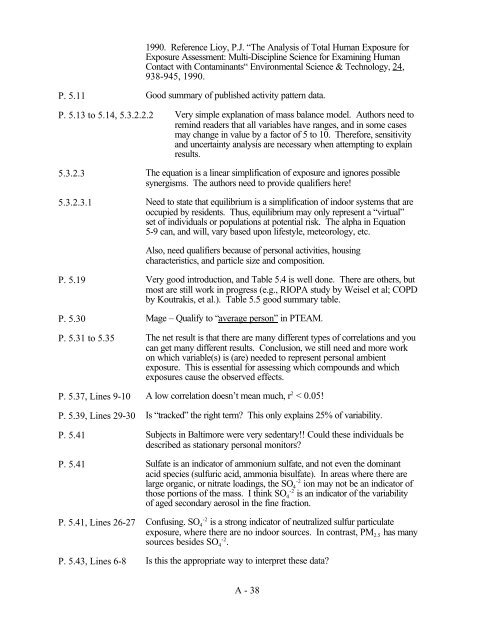
1990. Reference Lioy, P.J. “The Analysis <strong>of</strong> Total Human Exposure <strong>for</strong>Exposure Assessment: Multi-Discipline Science <strong>for</strong> Examining HumanContact with Contaminants“ Environmental Science & Technology, 24,938-945, 1990.P. 5.11 Good summary <strong>of</strong> published activity pattern data.P. 5.13 to 5.14, 5.3.2.2.2 Very simple explanation <strong>of</strong> mass balance model. Authors need toremind readers that all variables have ranges, and in some casesmay change in value by a factor <strong>of</strong> 5 to 10. There<strong>for</strong>e, sensitivityand uncertainty analysis are necessary when attempting to explainresults.5.3.2.3 The equation is a linear simplification <strong>of</strong> exposure and ignores possiblesynergisms. The authors need to provide qualifiers here!5.3.2.3.1 Need to state that equilibrium is a simplification <strong>of</strong> indoor systems that areoccupied by residents. Thus, equilibrium may only represent a “virtual”set <strong>of</strong> individuals or populations at potential risk. The alpha in Equation5-9 can, and will, vary based upon lifestyle, meteorology, etc.Also, need qualifiers because <strong>of</strong> personal activities, housingcharacteristics, and particle size and composition.P. 5.19 Very good introduction, and Table 5.4 is well done. There are o<strong>the</strong>rs, butmost are still work in progress (e.g., RIOPA study by Weisel et al; COPDby Koutrakis, et al.). Table 5.5 good summary table.P. 5.30 Mage – Qualify to “average person” in PTEAM.P. 5.31 to 5.35 The net result is that <strong>the</strong>re are many different types <strong>of</strong> correlations and youcan get many different results. Conclusion, we still need and more workon which variable(s) is (are) needed to represent personal ambientexposure. This is essential <strong>for</strong> assessing which compounds and whichexposures cause <strong>the</strong> observed effects.P. 5.37, Lines 9-10 A low correlation doesn’t mean much, r 2 < 0.05!P. 5.39, Lines 29-30 Is “tracked” <strong>the</strong> right term? This only explains 25% <strong>of</strong> variability.P. 5.41 Subjects in Baltimore were very sedentary!! Could <strong>the</strong>se individuals bedescribed as stationary personal monitors?P. 5.41 Sulfate is an indicator <strong>of</strong> ammonium sulfate, and not even <strong>the</strong> dominantacid species (sulfuric acid, ammonia bisulfate). In areas where <strong>the</strong>re arelarge organic, or nitrate loadings, <strong>the</strong> SO 4-2ion may not be an indicator <strong>of</strong>those portions <strong>of</strong> <strong>the</strong> mass. I think SO 4-2is an indicator <strong>of</strong> <strong>the</strong> variability<strong>of</strong> aged secondary aerosol in <strong>the</strong> fine fraction.P. 5.41, Lines 26-27 Confusing. SO 4-2is a strong indicator <strong>of</strong> neutralized sulfur particulateexposure, where <strong>the</strong>re are no indoor sources. In contrast, PM 2.5 has manysources besides SO 4-2.P. 5.43, Lines 6-8 Is this <strong>the</strong> appropriate way to interpret <strong>the</strong>se data?A - 38
- Page 5: known, the potential causes deserve
- Page 10: SCIENCE ADVISORY BOARD STAFFMr. A.
- Page 13 and 14: Page 2-77, line 19-22: Should menti
- Page 15 and 16: Page 8-1, lines 26-28: Combustion a
- Page 17 and 18: mode vs. the other. In fact, such k
- Page 19 and 20: p. 7-49, l. 20 In an effort to make
- Page 21 and 22: ambient PM effects. The paragraph d
- Page 23 and 24: dominant, one criticism is that “
- Page 25 and 26: 6. Susceptible sub-populationsIt is
- Page 27 and 28: is OK. But in most settings it stil
- Page 29 and 30: 2. There are repetitions of the sam
- Page 31 and 32: 15. Page 3-57 and 3-58, line 29-31
- Page 33 and 34: P 7- 27, L 15: What does “compara
- Page 35 and 36: there is pertains almost solely to
- Page 37 and 38: studies, and is presented as observ
- Page 39 and 40: P 8-47, L 23-27: These two sentence
- Page 41 and 42: also be summarized. Second, the cha
- Page 43 and 44: P 9-76, L 30: It should be “these
- Page 45 and 46: 4. Page 4-7,lines 14-18. Similar th
- Page 47: control when it may be possible to
- Page 51 and 52: document.P. 5-82, Lines 15-30 Need
- Page 53 and 54: 7-12 8 insert "that are either very
- Page 55 and 56: 8-62 10,11 The preceding discussion
- Page 57 and 58: 9-27 17 insert "source and/or" afte
- Page 59 and 60: 2. The paper by Künzli et al. on t
- Page 61 and 62: 6-243 12 This section (6.4.4.) shou
- Page 63 and 64: Chapter 5. Human Exposure to PM and
- Page 65 and 66: the chapter. Many of the poor quali
- Page 67 and 68: Page 5-17, equation 5-10; the coeff
- Page 69 and 70: illustrated using a figure from Kel
- Page 71 and 72: tied back to the base-line health s
- Page 73 and 74: Page 7-4, Structure of the Respirat
- Page 75 and 76: Günter Oberdörster, PhDChapter 7
- Page 77 and 78: efficiencies as well as the ratio o
- Page 79 and 80: The title of this section is also s
- Page 81 and 82: old and young rats and mice used on
- Page 83 and 84: passive use values as opposed to us
- Page 85 and 86: Specific Comments:Page 5-19, lines
- Page 87 and 88: Chapter 9 - General CommentsThis ch
- Page 89 and 90: George Taylor, PhDAir Quality Crite
- Page 91 and 92: atmospheric stressors associated wi
- Page 93 and 94: “At the surface, a variable fract
- Page 95 and 96: that point from this review! “Vis
- Page 97 and 98: 6. P 2-86, section 2.2.5.1 - A shor