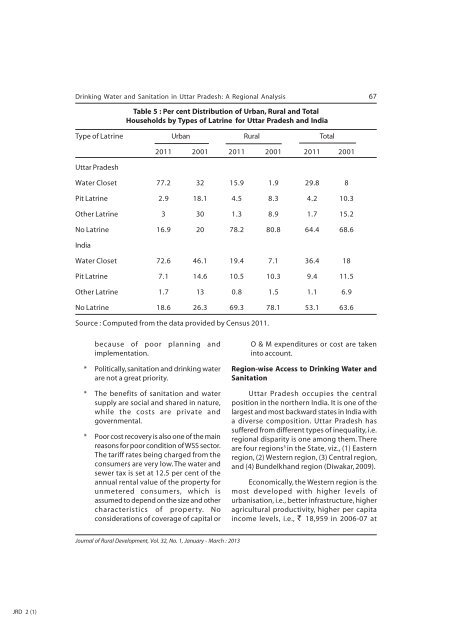
Drinking Water and Sanitation in Uttar Pradesh: A Regional Analysis 67Table 5 : Per cent Distribution <strong>of</strong> Urban, <strong>Rural</strong> and TotalHouseholds by Types <strong>of</strong> Latrine for Uttar Pradesh and IndiaType <strong>of</strong> Latrine Urban <strong>Rural</strong> TotalUttar Pradesh2011 2001 2011 2001 2011 2001Water Closet 77.2 32 15.9 1.9 29.8 8Pit Latrine 2.9 18.1 4.5 8.3 4.2 10.3Other Latrine 3 30 1.3 8.9 1.7 15.2No Latrine 16.9 20 78.2 80.8 64.4 68.6IndiaWater Closet 72.6 46.1 19.4 7.1 36.4 18Pit Latrine 7.1 14.6 10.5 10.3 9.4 11.5Other Latrine 1.7 13 0.8 1.5 1.1 6.9No Latrine 18.6 26.3 69.3 78.1 53.1 63.6Source : Computed from the data provided by Census 2011.because <strong>of</strong> poor planning andimplementation.* Politically, sanitation and drinking waterare not a great priority.* The benefits <strong>of</strong> sanitation and watersupply are social and shared in nature,while the costs are private andgovernmental.* Poor cost recovery is also one <strong>of</strong> the mainreasons for poor condition <strong>of</strong> WSS sector.The tariff rates being charged from theconsumers are very low. The water andsewer tax is set at 12.5 per cent <strong>of</strong> theannual rental value <strong>of</strong> the property forunmetered consumers, which isassumed to depend on the size and othercharacteristics <strong>of</strong> property. Noconsiderations <strong>of</strong> coverage <strong>of</strong> capital orO & M expenditures or cost are takeninto account.Region-wise Access to Drinking Water andSanitationUttar Pradesh occupies the centralposition in the northern India. It is one <strong>of</strong> thelargest and most backward states in India witha diverse composition. Uttar Pradesh hassuffered from different types <strong>of</strong> inequality, i.e.regional disparity is one among them. Thereare four regions 5 in the State, viz., (1) Easternregion, (2) Western region, (3) Central region,and (4) Bundelkhand region (Diwakar, 2009).Economically, the Western region is themost developed with higher levels <strong>of</strong>urbanisation, i.e., better infrastructure, higheragricultural productivity, higher per capitaincome levels, i.e., ` 18,959 in 2006-07 atJournal <strong>of</strong> <strong>Rural</strong> <strong>Development</strong>, Vol. 32, No. 1, <strong>January</strong> - <strong>March</strong> : <strong>2013</strong>JRD 2 (1)
68 Rashmi Tiwari and Sanatan Nayakcurrent price, and lower poverty levels (Govt.<strong>of</strong> Uttar Pradesh, 2010-11). Eastern regionsuffers from high population pressure and lowdegree <strong>of</strong> diversification <strong>of</strong> the economy,while Bundelkhand region falls in the droughtpronedry region. The Central region scoresrelatively better in terms <strong>of</strong> economicindicators as compared to the two backwardregions (Government <strong>of</strong> Uttar Pradesh, 2010-11).The Government <strong>of</strong> India considers onlytap, tubewell, and handpump (TWHP) aspotable sources. According to the definition<strong>of</strong> Census <strong>of</strong> India, if a household has accessto drinking water from a tap, tubewell orhandpump situated within or outside thepremises, it is considered as having access tosafe/improved drinking water (Lohia, Shital,2006). Based on the above definition, thestructure and extent <strong>of</strong> drinking water facilityhas been assessed as follows.As per the District Level HouseholdSurvey (DLHS-2&3), the coverage withTable 6 : Access to Improved Drinking Water in U. P. in Different Regions(in per cent)Region DLHS -2 DLHS -3 Difference <strong>of</strong>(2002-04) (2007-08) DLHS -2 & 3Eastern region 90.31 93.27 2.96Western region 93.75 97.99 4.24Central region 87.2 93.44 6.24Bundelkhand region 79.21 90.51 11.3Uttar Pradesh 90.8 94.8 4.0Source : Computed from the data provided by DLHS-2 and DLHS-3, Uttar Pradesh, IIPS, Mumbai.improved drinking water is 94.8 per cent inUttar Pradesh. This coverage only indicates thepercentage <strong>of</strong> households using potablesources for their drinking water needs. But thisdoes not mean that 94.8 per cent <strong>of</strong>households have adequate drinking waterfacilities. Various studies also confirm that thecoverage figures do not reflect actualavailability <strong>of</strong> water supply, which is betterreflected by service quality indicators such ashours <strong>of</strong> supply, water quality and quantity(Mavalankar, F. & M. Shankar, 2004; Pandey, etal, 2006; Pushpangadan, 2006 and Mingxuan,F. & Bhano ji Rao, 2011).There are considerable inter-regionaldisparities so far as access to drinking waterwith improved source are concerned (Table6). Western region is the only region that hasreached above 95 per cent coverage withimproved drinking water. As various studiesconfirm, there is a positive relationshipbetween the level <strong>of</strong> economic developmentand access to drinking water. Developed statesreport a high percentage <strong>of</strong> households havingaccess to safe drinking water (Kundu & Thakur,2006 and Zerah, 2006).Bundelkhand region has lowest accessto drinking water in both surveys among allregions but it reports highest improvement incoverage (11.3 per cent) in between DLHS-2&3. This region has distinct naturalcharacteristics as compared to the otherJournal <strong>of</strong> <strong>Rural</strong> <strong>Development</strong>, Vol. 32, No. 1, <strong>January</strong> - <strong>March</strong> : <strong>2013</strong>JRD 2 (1)
- Page 2 and 3:
Journal ofRural DevelopmentVol. 32
- Page 4 and 5:
Journal of Rural Development, Vol.
- Page 6 and 7:
Small and Medium Enterprises In the
- Page 8 and 9:
Small and Medium Enterprises In the
- Page 10 and 11:
Small and Medium Enterprises In the
- Page 12 and 13:
Small and Medium Enterprises In the
- Page 14 and 15:
Small and Medium Enterprises In the
- Page 16 and 17:
Small and Medium Enterprises In the
- Page 18 and 19:
Small and Medium Enterprises In the
- Page 20: Small and Medium Enterprises In the
- Page 23 and 24: 20 Biju Paul Abraham, Bhaskar Chakr
- Page 25 and 26: 22 Biju Paul Abraham, Bhaskar Chakr
- Page 27 and 28: 24 Biju Paul Abraham, Bhaskar Chakr
- Page 29 and 30: 26 Biju Paul Abraham, Bhaskar Chakr
- Page 31 and 32: 28 Biju Paul Abraham, Bhaskar Chakr
- Page 33 and 34: 30 Biju Paul Abraham, Bhaskar Chakr
- Page 36 and 37: Journal of Rural Development, Vol.
- Page 38 and 39: Socio-Economic Impoverishment Risks
- Page 40 and 41: Socio-Economic Impoverishment Risks
- Page 42 and 43: Socio-Economic Impoverishment Risks
- Page 44 and 45: Socio-Economic Impoverishment Risks
- Page 46 and 47: Socio-Economic Impoverishment Risks
- Page 48 and 49: Socio-Economic Impoverishment Risks
- Page 50 and 51: Journal of Rural Development, Vol.
- Page 52 and 53: Empowerment from the Above - Respon
- Page 54 and 55: Empowerment from the Above - Respon
- Page 56 and 57: Empowerment from the Above - Respon
- Page 58 and 59: Empowerment from the Above - Respon
- Page 60 and 61: Empowerment from the Above - Respon
- Page 62: Empowerment from the Above - Respon
- Page 65 and 66: 62 Rashmi Tiwari and Sanatan Nayaka
- Page 67 and 68: 64 Rashmi Tiwari and Sanatan NayakT
- Page 69: 66 Rashmi Tiwari and Sanatan NayakT
- Page 73 and 74: 70 Rashmi Tiwari and Sanatan NayakT
- Page 75 and 76: 72 Rashmi Tiwari and Sanatan NayakU
- Page 77 and 78: 74 Rashmi Tiwari and Sanatan Nayak2
- Page 79 and 80: 76 Arijit Royincreasing temperature
- Page 81 and 82: 78 Arijit RoyS is land size (in big
- Page 83 and 84: 80 Arijit RoyThe number of cattle p
- Page 85 and 86: 82 Arijit RoyThe role of Panchayats
- Page 87 and 88: 84 Arijit Royper cent. β2 is signi
- Page 90 and 91: Journal of Rural Development, Vol.
- Page 92 and 93: Extent of People’s Participation
- Page 94 and 95: Extent of People’s Participation
- Page 96 and 97: Extent of People’s Participation
- Page 98 and 99: Extent of People’s Participation
- Page 100 and 101: Book Journal Reviews of Rural Devel
- Page 102 and 103: Book Reviews 99poverty, between agr
- Page 104 and 105: Book Reviews 101areas. The authors
- Page 106 and 107: Book Reviews 103the changes in the
- Page 108 and 109: Book Reviews 105In Chapter five the
- Page 110 and 111: Journal of Rural Development(Quarte
- Page 112: 3. An article published in an edite