January - March 2013 - National Institute of Rural Development
January - March 2013 - National Institute of Rural Development
January - March 2013 - National Institute of Rural Development
- No tags were found...

Create successful ePaper yourself
Turn your PDF publications into a flip-book with our unique Google optimized e-Paper software.
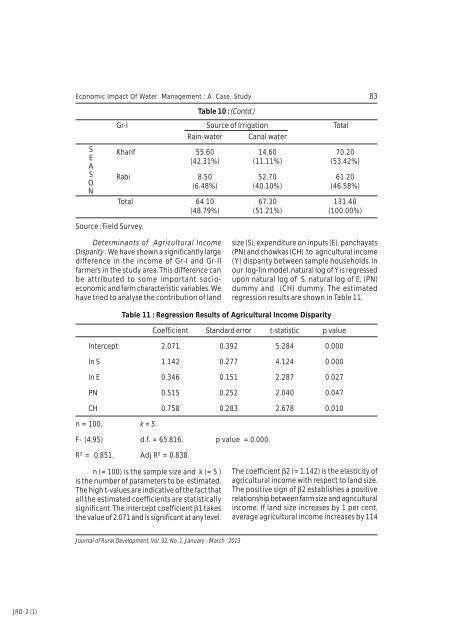
Economic Impact Of Water Management : A Case Study 83Table 10 : (Contd.)SEASONGr-I Source <strong>of</strong> Irrigation TotalRain-water Canal waterKharif 55.60 14.60 70.20(42.31%) (11.11%) (53.42%)Rabi 8.50 52.70 61.20(6.48%) (40.10%) (46.58%)Total 64.10 67.30 131.40(48.79%) (51.21%) (100.00%)Source : Field Survey.Determinants <strong>of</strong> Agricultural IncomeDisparity : We have shown a significantly largedifference in the income <strong>of</strong> Gr-I and Gr-IIfarmers in the study area. This difference canbe attributed to some important socioeconomicand farm characteristic variables. Wehave tried to analyse the contribution <strong>of</strong> landsize (S), expenditure on inputs (E), panchayats(PN) and chowkas (CH) to agricultural income(Y) disparity between sample households. Inour log-lin model, natural log <strong>of</strong> Y is regressedupon natural log <strong>of</strong> S, natural log <strong>of</strong> E, (PN)dummy and (CH) dummy. The estimatedregression results are shown in Table 11.Table 11 : Regression Results <strong>of</strong> Agricultural Income DisparityCoefficient Standard error t-statistic p valueIntercept 2.071 0.392 5.284 0.000ln S 1.142 0.277 4.124 0.000ln E 0.346 0.151 2.287 0.027PN 0.515 0.252 2.040 0.047CH 0.758 0.283 2.678 0.010n = 100, k = 5.F- (4,95) d.f. = 65.816, p value = 0.000.R² = 0.851, Adj R² = 0.838.n (= 100) is the sample size and k (= 5 )is the number <strong>of</strong> parameters to be estimated.The high t-values are indicative <strong>of</strong> the fact thatall the estimated coefficients are statisticallysignificant. The intercept coefficient β1 takesthe value <strong>of</strong> 2.071 and is significant at any level.The coefficient β2 (= 1.142) is the elasticity <strong>of</strong>agricultural income with respect to land size.The positive sign <strong>of</strong> β2 establishes a positiverelationship between farm size and agriculturalincome. If land size increases by 1 per cent,average agricultural income increases by 114Journal <strong>of</strong> <strong>Rural</strong> <strong>Development</strong>, Vol. 32, No. 1, <strong>January</strong> - <strong>March</strong> : <strong>2013</strong>JRD 2 (1)