"Top Incomes in the Long Run of History" with Tony Atkinson and
"Top Incomes in the Long Run of History" with Tony Atkinson and
"Top Incomes in the Long Run of History" with Tony Atkinson and

Create successful ePaper yourself
Turn your PDF publications into a flip-book with our unique Google optimized e-Paper software.
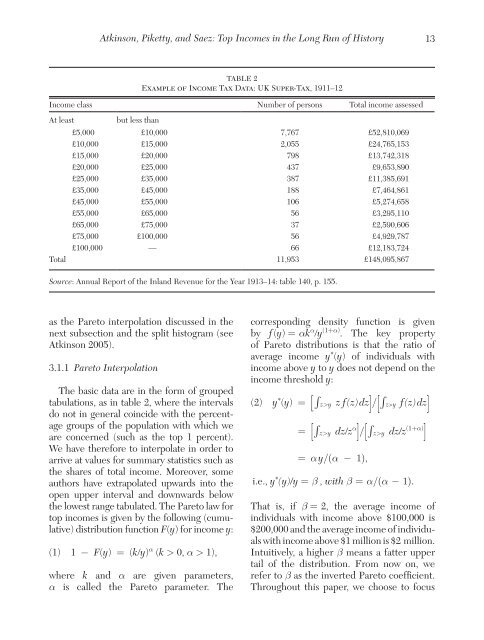
Atk<strong>in</strong>son, Piketty, <strong>and</strong> Saez: <strong>Top</strong> <strong>Incomes</strong> <strong>in</strong> <strong>the</strong> <strong>Long</strong> <strong>Run</strong> <strong>of</strong> History13Table 2Example <strong>of</strong> Income Tax Data: UK Super-Tax, 1911–12Income class Number <strong>of</strong> persons Total <strong>in</strong>come assessedAt leastbut less than£5,000 £10,000 7,767 £52,810,069£10,000 £15,000 2,055 £24,765,153£15,000 £20,000 798 £13,742,318£20,000 £25,000 437 £9,653,890£25,000 £35,000 387 £11,385,691£35,000 £45,000 188 £7,464,861£45,000 £55,000 106 £5,274,658£55,000 £65,000 56 £3,295,110£65,000 £75,000 37 £2,590,606£75,000 £100,000 56 £4,929,787£100,000 — 66 £12,183,724Total 11,953 £148,095,867Source: Annual Report <strong>of</strong> <strong>the</strong> Inl<strong>and</strong> Revenue for <strong>the</strong> Year 1913–14: table 140, p. 155.as <strong>the</strong> Pareto <strong>in</strong>terpolation discussed <strong>in</strong> <strong>the</strong>next subsection <strong>and</strong> <strong>the</strong> split histogram (seeAtk<strong>in</strong>son 2005).3.1.1 Pareto InterpolationThe basic data are <strong>in</strong> <strong>the</strong> form <strong>of</strong> groupedtabulations, as <strong>in</strong> table 2, where <strong>the</strong> <strong>in</strong>tervalsdo not <strong>in</strong> general co<strong>in</strong>cide <strong>with</strong> <strong>the</strong> percentagegroups <strong>of</strong> <strong>the</strong> population <strong>with</strong> which weare concerned (such as <strong>the</strong> top 1 percent).We have <strong>the</strong>refore to <strong>in</strong>terpolate <strong>in</strong> order toarrive at values for summary statistics such as<strong>the</strong> shares <strong>of</strong> total <strong>in</strong>come. Moreover, someauthors have extrapolated upwards <strong>in</strong>to <strong>the</strong>open upper <strong>in</strong>terval <strong>and</strong> downwards below<strong>the</strong> lowest range tabulated. The Pareto law fortop <strong>in</strong>comes is given by <strong>the</strong> follow<strong>in</strong>g (cumulative)distribution function F(y) for <strong>in</strong>come y:(1) 1 − F(y) = (k/y) α (k > 0, α > 1),where k <strong>and</strong> α are given parameters,α is called <strong>the</strong> Pareto parameter. Thecorrespond<strong>in</strong>g density function is givenby f (y) = αk α /y (1+α) . The key property<strong>of</strong> Pareto distributions is that <strong>the</strong> ratio <strong>of</strong>average <strong>in</strong>come y * (y) <strong>of</strong> <strong>in</strong>dividuals <strong>with</strong><strong>in</strong>come above y to y does not depend on <strong>the</strong><strong>in</strong>come threshold y:(2) y * (y) = [ ∫ z>y z f (z) dz ] / [ ∫ z>y f (z) dz ]= [∫ z>y dz/z α ]/[∫ z>y dz/z (1+α) ]= α y/(α − 1),i.e., y * (y)/y = β , <strong>with</strong> β = α/(α − 1).That is, if β = 2, <strong>the</strong> average <strong>in</strong>come <strong>of</strong><strong>in</strong>dividuals <strong>with</strong> <strong>in</strong>come above $100,000 is$200,000 <strong>and</strong> <strong>the</strong> average <strong>in</strong>come <strong>of</strong> <strong>in</strong>dividuals<strong>with</strong> <strong>in</strong>come above $1 million is $2 million.Intuitively, a higher β means a fatter uppertail <strong>of</strong> <strong>the</strong> distribution. From now on, werefer to β as <strong>the</strong> <strong>in</strong>verted Pareto coefficient.Throughout this paper, we choose to focus