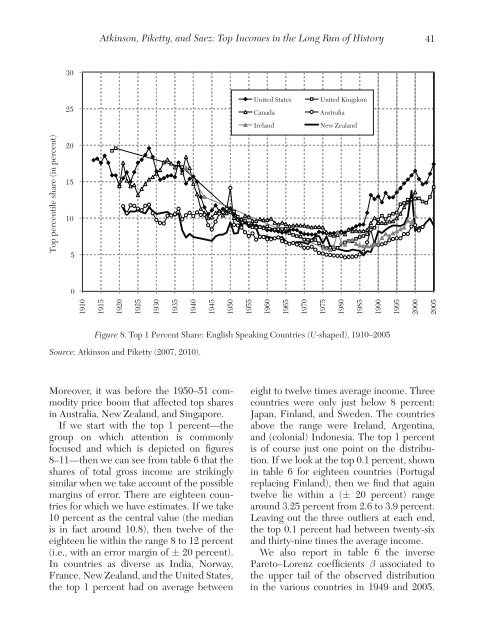
40Journal <strong>of</strong> Economic Literature, Vol. XLIX (March 2011)<strong>the</strong> United K<strong>in</strong>gdom (12.5 percent <strong>in</strong> 1998),or <strong>the</strong> United States (15.3 percent <strong>in</strong> 1998).To sum up, <strong>the</strong> different pieces <strong>of</strong> evidence<strong>in</strong>dicate that tax evasion <strong>and</strong> tax avoidanceneed to be taken seriously <strong>and</strong> can quantitativelyaffect <strong>the</strong> conclusions drawn. Theyneed to be borne <strong>in</strong> m<strong>in</strong>d when consider<strong>in</strong>g<strong>the</strong> results but <strong>the</strong>y are not so large as tomean that <strong>the</strong> tax data should be rejected out<strong>of</strong> h<strong>and</strong>. Our view is that legally tax-exemptcapital <strong>in</strong>come poses more serious problemsthan tax evasion <strong>and</strong> tax avoidance per se.3.2.4 Income MobilityA classical objection to <strong>in</strong>equality measuresbased on annual cross sectional <strong>in</strong>comeis that <strong>in</strong>dividuals move up or down <strong>the</strong> distribution<strong>of</strong> <strong>in</strong>come over time. If <strong>in</strong>dividualscan use credit markets to smooth fluctuations<strong>in</strong> <strong>in</strong>come, <strong>the</strong>n annual <strong>in</strong>come mightnot be a good measure <strong>of</strong> economic welfare.Therefore, analyz<strong>in</strong>g <strong>in</strong>come mobility is valuablealthough it requires access to panel data.Saez <strong>and</strong> Veall (2005) <strong>and</strong> Kopcuzk, Saez, <strong>and</strong>Song (2010) have analyzed jo<strong>in</strong>tly <strong>in</strong>equality<strong>and</strong> mobility for at <strong>the</strong> top <strong>of</strong> <strong>the</strong> <strong>in</strong>dividualwage earn<strong>in</strong>gs distributions <strong>in</strong> Canada <strong>and</strong><strong>the</strong> United States. They found that mobility,measured as <strong>the</strong> probability to drop out <strong>of</strong> <strong>the</strong>top percentile from one year to <strong>the</strong> next, hasbeen remarkably stable over <strong>the</strong> last decadeseven though top wage earn<strong>in</strong>gs shares surged<strong>in</strong> both countries. As a result, <strong>in</strong>creasedmobility did not mitigate <strong>in</strong>creases <strong>in</strong> annualtop earn<strong>in</strong>gs shares. It would be valuable toextend such mobility analyzes at <strong>the</strong> top <strong>of</strong><strong>the</strong> distribution to o<strong>the</strong>r countries <strong>and</strong> tototal <strong>in</strong>come (<strong>in</strong>stead <strong>of</strong> just wage earn<strong>in</strong>gs).4. A Summary <strong>of</strong> <strong>the</strong> Ma<strong>in</strong> F<strong>in</strong>d<strong>in</strong>gsWe depict <strong>in</strong> <strong>the</strong> annual top 1 percentshare <strong>of</strong> total gross <strong>in</strong>come series for twentytwo<strong>in</strong>dividual countries grouped <strong>in</strong> figures8–11 as follows: figure 8—Western Englishspeak<strong>in</strong>g countries (United States, Canada,United K<strong>in</strong>gdom, Irel<strong>and</strong>, Australia, NewZeal<strong>and</strong>); figure 9—Cont<strong>in</strong>ental CentralEuropean countries (France, Germany,Ne<strong>the</strong>rl<strong>and</strong>s, Switzerl<strong>and</strong>) <strong>and</strong> Japan; figure10—Nordic European countries (Norway,Sweden, F<strong>in</strong>l<strong>and</strong>) <strong>and</strong> Sou<strong>the</strong>rn Europeancountries (Portugal, Spa<strong>in</strong>, Italy); <strong>and</strong> figure11—Develop<strong>in</strong>g countries (Ch<strong>in</strong>a,India, S<strong>in</strong>gapore, Indonesia, Argent<strong>in</strong>a). Aswe shall see, <strong>the</strong> group<strong>in</strong>g is made not onlyon cultural or geographical proximity butalso on proximity <strong>of</strong> <strong>the</strong> historical evolution<strong>of</strong> top <strong>in</strong>come shares. In all cases, we haveused series exclud<strong>in</strong>g realized capital ga<strong>in</strong>s(as only a subset <strong>of</strong> countries present series<strong>in</strong>clud<strong>in</strong>g capital ga<strong>in</strong>s, <strong>and</strong> <strong>in</strong> those cases,series exclud<strong>in</strong>g capital ga<strong>in</strong>s have also beenproduced). We have used <strong>the</strong> same y-axisscale <strong>in</strong> all four figures to facilitate comparisonsacross figures. Western Englishspeak<strong>in</strong>g countries <strong>in</strong> figure 8 display a clearU-shape over <strong>the</strong> century. Cont<strong>in</strong>ental centralEuropean countries <strong>and</strong> Japan <strong>in</strong> figure 9display an L-shape over <strong>the</strong> century. Nordic<strong>and</strong> Sou<strong>the</strong>rn European countries display apattern <strong>in</strong> between a U <strong>and</strong> a L shape <strong>in</strong> figure10 as <strong>the</strong> drop <strong>in</strong> <strong>the</strong> early part <strong>of</strong> <strong>the</strong>period is much more pronounced than <strong>the</strong>rebound <strong>in</strong> <strong>the</strong> late part <strong>of</strong> period. F<strong>in</strong>ally,develop<strong>in</strong>g countries <strong>in</strong> figure 11 also displaya U/L shape pattern although <strong>the</strong>re is substantialheterogeneity <strong>in</strong> this group.Let us summarize first <strong>the</strong> evidence <strong>in</strong> <strong>the</strong>middle <strong>of</strong> <strong>the</strong> twentieth century. The firstcolumns <strong>in</strong> table 6 show <strong>the</strong> position <strong>in</strong> 1949(1950). 29 We take this year as one for whichwe have estimates for all except four <strong>of</strong> <strong>the</strong>twenty-two countries, <strong>and</strong> as one when mostcountries had begun to return to normalityafter <strong>the</strong> Second World War (for Germany<strong>and</strong> <strong>the</strong> Ne<strong>the</strong>rl<strong>and</strong>s we take 1950).29 In <strong>the</strong> case <strong>of</strong> New Zeal<strong>and</strong>, we have used <strong>the</strong> estimates<strong>of</strong> Atk<strong>in</strong>son <strong>and</strong> Leigh (2008: table 1) that adjust for<strong>the</strong> change <strong>in</strong> <strong>the</strong> tax unit <strong>in</strong> 1953. For Indonesia we havetaken <strong>the</strong> 1939 estimate <strong>and</strong> for Irel<strong>and</strong> that for 1943.
Atk<strong>in</strong>son, Piketty, <strong>and</strong> Saez: <strong>Top</strong> <strong>Incomes</strong> <strong>in</strong> <strong>the</strong> <strong>Long</strong> <strong>Run</strong> <strong>of</strong> History413025United StatesCanadaIrel<strong>and</strong>United K<strong>in</strong>gdomAustraliaNew Zeal<strong>and</strong>2015105019101915192019251930193519401945195019551960196519701975198019851990199520002005<strong>Top</strong> percentile share (<strong>in</strong> percent)Figure 8. <strong>Top</strong> 1 Percent Share: English Speak<strong>in</strong>g Countries (U-shaped), 1910–2005Source: Atk<strong>in</strong>son <strong>and</strong> Piketty (2007, 2010).Moreover, it was before <strong>the</strong> 1950–51 commodityprice boom that affected top shares<strong>in</strong> Australia, New Zeal<strong>and</strong>, <strong>and</strong> S<strong>in</strong>gapore.If we start <strong>with</strong> <strong>the</strong> top 1 percent—<strong>the</strong>group on which attention is commonlyfocused <strong>and</strong> which is depicted on figures8–11—<strong>the</strong>n we can see from table 6 that <strong>the</strong>shares <strong>of</strong> total gross <strong>in</strong>come are strik<strong>in</strong>glysimilar when we take account <strong>of</strong> <strong>the</strong> possiblemarg<strong>in</strong>s <strong>of</strong> error. There are eighteen countriesfor which we have estimates. If we take10 percent as <strong>the</strong> central value (<strong>the</strong> medianis <strong>in</strong> fact around 10.8), <strong>the</strong>n twelve <strong>of</strong> <strong>the</strong>eighteen lie <strong>with</strong><strong>in</strong> <strong>the</strong> range 8 to 12 percent(i.e., <strong>with</strong> an error marg<strong>in</strong> <strong>of</strong> ± 20 percent).In countries as diverse as India, Norway,France, New Zeal<strong>and</strong>, <strong>and</strong> <strong>the</strong> United States,<strong>the</strong> top 1 percent had on average betweeneight to twelve times average <strong>in</strong>come. Threecountries were only just below 8 percent:Japan, F<strong>in</strong>l<strong>and</strong>, <strong>and</strong> Sweden. The countriesabove <strong>the</strong> range were Irel<strong>and</strong>, Argent<strong>in</strong>a,<strong>and</strong> (colonial) Indonesia. The top 1 percentis <strong>of</strong> course just one po<strong>in</strong>t on <strong>the</strong> distribution.If we look at <strong>the</strong> top 0.1 percent, shown<strong>in</strong> table 6 for eighteen countries (Portugalreplac<strong>in</strong>g F<strong>in</strong>l<strong>and</strong>), <strong>the</strong>n we f<strong>in</strong>d that aga<strong>in</strong>twelve lie <strong>with</strong><strong>in</strong> a (± 20 percent) rangearound 3.25 percent from 2.6 to 3.9 percent.Leav<strong>in</strong>g out <strong>the</strong> three outliers at each end,<strong>the</strong> top 0.1 percent had between twenty-six<strong>and</strong> thirty-n<strong>in</strong>e times <strong>the</strong> average <strong>in</strong>come.We also report <strong>in</strong> table 6 <strong>the</strong> <strong>in</strong>versePareto–Lorenz coefficients β associated to<strong>the</strong> upper tail <strong>of</strong> <strong>the</strong> observed distribution<strong>in</strong> <strong>the</strong> various countries <strong>in</strong> 1949 <strong>and</strong> 2005.
- Page 5 and 6: Atkinson, Piketty, and Saez: Top In
- Page 7 and 8: Atkinson, Piketty, and Saez: Top In
- Page 9 and 10: Atkinson, Piketty, and Saez: Top In
- Page 11 and 12: Atkinson, Piketty, and Saez: Top In
- Page 13 and 14: Atkinson, Piketty, and Saez: Top In
- Page 15 and 16: Atkinson, Piketty, and Saez: Top In
- Page 17 and 18: Atkinson, Piketty, and Saez: Top In
- Page 19 and 20: Atkinson, Piketty, and Saez: Top In
- Page 21 and 22: Atkinson, Piketty, and Saez: Top In
- Page 23 and 24: Atkinson, Piketty, and Saez: Top In
- Page 25 and 26: Atkinson, Piketty, and Saez: Top In
- Page 27 and 28: Atkinson, Piketty, and Saez: Top In
- Page 29 and 30: Atkinson, Piketty, and Saez: Top In
- Page 31 and 32: Atkinson, Piketty, and Saez: Top In
- Page 33 and 34: Atkinson, Piketty, and Saez: Top In
- Page 35 and 36: Atkinson, Piketty, and Saez: Top In
- Page 37: Atkinson, Piketty, and Saez: Top In
- Page 41 and 42: Atkinson, Piketty, and Saez: Top In
- Page 43 and 44: Atkinson, Piketty, and Saez: Top In
- Page 45 and 46: Atkinson, Piketty, and Saez: Top In
- Page 47 and 48: Atkinson, Piketty, and Saez: Top In
- Page 49 and 50: Atkinson, Piketty, and Saez: Top In
- Page 51 and 52: Atkinson, Piketty, and Saez: Top In
- Page 53 and 54: Atkinson, Piketty, and Saez: Top In
- Page 55 and 56: Atkinson, Piketty, and Saez: Top In
- Page 57 and 58: Atkinson, Piketty, and Saez: Top In
- Page 59 and 60: Atkinson, Piketty, and Saez: Top In
- Page 61 and 62: Atkinson, Piketty, and Saez: Top In
- Page 63 and 64: Atkinson, Piketty, and Saez: Top In
- Page 65 and 66: Atkinson, Piketty, and Saez: Top In
- Page 67 and 68: Atkinson, Piketty, and Saez: Top In
- Page 69: Atkinson, Piketty, and Saez: Top In