48Journal <strong>of</strong> Economic Literature, Vol. XLIX (March 2011)1807–1914 period (<strong>with</strong> an acceleration <strong>of</strong><strong>the</strong> trend <strong>in</strong> <strong>the</strong> last three to four decadesprior to 1914) <strong>and</strong> that <strong>the</strong> downturn did notstart until <strong>the</strong> First World War. Due to <strong>the</strong>lack <strong>of</strong> similar wealth series for o<strong>the</strong>r countries,it is difficult to know whe<strong>the</strong>r this is ageneral pattern.4.2 The Postwar PictureReturn<strong>in</strong>g to more recent times, we cansee that <strong>the</strong>re was considerable diversity <strong>of</strong>experience over <strong>the</strong> period from 1949 to<strong>the</strong> beg<strong>in</strong>n<strong>in</strong>g <strong>of</strong> <strong>the</strong> twenty-first century.If we ask <strong>in</strong> how many cases <strong>the</strong> share <strong>of</strong><strong>the</strong> top 1 percent rose or fell by more than2 percentage po<strong>in</strong>ts between 1949 <strong>and</strong> 2005(bear<strong>in</strong>g <strong>in</strong> m<strong>in</strong>d that two-thirds were <strong>in</strong> <strong>the</strong>range 8 to 12 percent <strong>in</strong> 1949), <strong>the</strong>n we f<strong>in</strong>d<strong>the</strong> seventeen countries more or less evenlydivided: six had a fall <strong>of</strong> two po<strong>in</strong>ts or more,five had a rise <strong>of</strong> two po<strong>in</strong>ts or more, <strong>and</strong> sixhad a smaller or no change. If we ask <strong>in</strong> howmany cases <strong>the</strong> <strong>in</strong>verted-Pareto–Lorenz βcoefficient changed by more than 0.1, <strong>the</strong>nthis was true <strong>of</strong> fifteen out <strong>of</strong> twenty countries<strong>in</strong> table 6, <strong>with</strong> twelve show<strong>in</strong>g a rise (amove to greater concentration). Exam<strong>in</strong>ation<strong>of</strong> <strong>the</strong> annual top 1 percent share data for<strong>in</strong>dividual countries is depicted on figures8–11 confirms that, dur<strong>in</strong>g <strong>the</strong> 50+ yearss<strong>in</strong>ce 1949, <strong>in</strong>dividual countries followed differenttime paths.Can we none<strong>the</strong>less draw any commonconclusions? Is it for example <strong>the</strong> case that allwere follow<strong>in</strong>g a U-shape, <strong>and</strong> that <strong>the</strong> differenceswhen compar<strong>in</strong>g 2005 <strong>and</strong> 1949 arisesimply because some countries are fur<strong>the</strong>radvanced? Is <strong>the</strong> United States lead<strong>in</strong>g <strong>the</strong>way, <strong>with</strong> o<strong>the</strong>r countries lagg<strong>in</strong>g? In table 8,we summarize <strong>the</strong> time paths from 1949 to2005 for <strong>the</strong> sixteen countries for which wehave fairly complete data over this period for<strong>the</strong> share <strong>of</strong> <strong>the</strong> top 1 percent <strong>and</strong> top 0.1percent. In focus<strong>in</strong>g on change, we are not<strong>in</strong>terested <strong>in</strong> small differences after <strong>the</strong> decimalpo<strong>in</strong>ts. The criterion applied <strong>in</strong> <strong>the</strong> case<strong>of</strong> <strong>the</strong> share <strong>of</strong> <strong>the</strong> top 1 percent is that usedabove: a change <strong>of</strong> 2 percentage po<strong>in</strong>ts ormore. For <strong>the</strong> share <strong>of</strong> <strong>the</strong> top 0.1 percent,we apply a criterion <strong>of</strong> 0.65 percentage po<strong>in</strong>ts(i.e., scaled by 3.25/10). In apply<strong>in</strong>g this, weconsider only susta<strong>in</strong>ed changes. This meansthat we do not recognize changes due to taxreforms that distort <strong>the</strong> figures as <strong>in</strong> <strong>the</strong> case<strong>of</strong> Norway (Aarberge <strong>and</strong> Atk<strong>in</strong>son 2010) orNew Zeal<strong>and</strong> (Atk<strong>in</strong>son <strong>and</strong> Leigh 2008),those due to <strong>the</strong> commodity price boom <strong>of</strong><strong>the</strong> early 1950s as for Australia, New Zeal<strong>and</strong>,<strong>and</strong> S<strong>in</strong>gapore, or o<strong>the</strong>r changes that are notma<strong>in</strong>ta<strong>in</strong>ed for several years.Apply<strong>in</strong>g this criterion, <strong>the</strong>re is just onecase—F<strong>in</strong>l<strong>and</strong>—where <strong>the</strong>re is a pattern<strong>of</strong> rise/fall/rise. The share <strong>of</strong> <strong>the</strong> top 1 percent<strong>in</strong> F<strong>in</strong>l<strong>and</strong> rose from below 8 percent<strong>in</strong> 1949 (it has been lower before <strong>the</strong>n) toaround 10 percent <strong>in</strong> <strong>the</strong> early 1960s. Of <strong>the</strong>rema<strong>in</strong><strong>in</strong>g fifteen countries, one can dist<strong>in</strong>guisha group <strong>of</strong> six “flat” countries (France,Germany, Switzerl<strong>and</strong>, <strong>the</strong> Ne<strong>the</strong>rl<strong>and</strong>s,Japan, S<strong>in</strong>ga pore) <strong>and</strong> a group <strong>of</strong> n<strong>in</strong>e“U-shaped” countries (United K<strong>in</strong>gdom,United States, Canada, Australia, NewZeal<strong>and</strong>, India, Argent<strong>in</strong>a, Sweden, Norway).The ten countries belong<strong>in</strong>g to <strong>the</strong> secondgroup appear to fit, to vary<strong>in</strong>g degrees,<strong>the</strong> U-shape hypo<strong>the</strong>sis that top shares havefirst fallen <strong>and</strong> <strong>the</strong>n risen over <strong>the</strong> postwarperiod. In most countries, <strong>the</strong> <strong>in</strong>itial fall was<strong>of</strong> limited size. As may be seen from table 8,<strong>the</strong> <strong>in</strong>itial falls <strong>in</strong> top shares were lessmarked <strong>in</strong> <strong>the</strong> United States, Canada, <strong>and</strong>New Zeal<strong>and</strong> than <strong>in</strong> <strong>the</strong> United K<strong>in</strong>gdom,Australia, <strong>and</strong> India. The share <strong>of</strong> <strong>the</strong> top1 percent was much <strong>the</strong> same <strong>in</strong> <strong>the</strong> UnitedStates <strong>and</strong> United K<strong>in</strong>gdom <strong>in</strong> 1949 but, <strong>in</strong><strong>the</strong> United K<strong>in</strong>gdom, <strong>the</strong> share <strong>the</strong>n halvedover <strong>the</strong> next quarter century, whereas <strong>in</strong><strong>the</strong> United States it fell by only a little overa quarter.The frontier between <strong>the</strong> U-shaped countries<strong>and</strong> <strong>the</strong> flat countries is somewhatarbitrary <strong>and</strong> should not be overstressed.
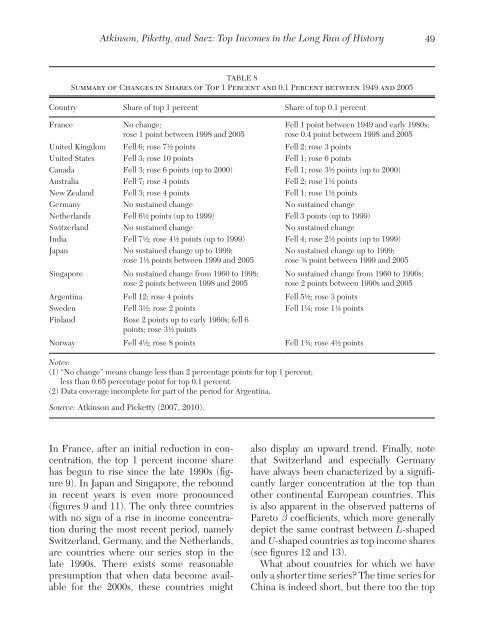
Atk<strong>in</strong>son, Piketty, <strong>and</strong> Saez: <strong>Top</strong> <strong>Incomes</strong> <strong>in</strong> <strong>the</strong> <strong>Long</strong> <strong>Run</strong> <strong>of</strong> History49Table 8Summary <strong>of</strong> Changes <strong>in</strong> Shares <strong>of</strong> <strong>Top</strong> 1 Percent <strong>and</strong> 0.1 Percent between 1949 <strong>and</strong> 2005Country Share <strong>of</strong> top 1 percent Share <strong>of</strong> top 0.1 percentFranceNo change;rose 1 po<strong>in</strong>t between 1998 <strong>and</strong> 2005Fell 1 po<strong>in</strong>t between 1949 <strong>and</strong> early 1980s;rose 0.4 po<strong>in</strong>t between 1998 <strong>and</strong> 2005United K<strong>in</strong>gdom Fell 6; rose 7½ po<strong>in</strong>ts Fell 2; rose 3 po<strong>in</strong>tsUnited States Fell 3; rose 10 po<strong>in</strong>ts Fell 1; rose 6 po<strong>in</strong>tsCanada Fell 3; rose 6 po<strong>in</strong>ts (up to 2000) Fell 1; rose 3½ po<strong>in</strong>ts (up to 2000)Australia Fell 7; rose 4 po<strong>in</strong>ts Fell 2; rose 1½ po<strong>in</strong>tsNew Zeal<strong>and</strong> Fell 3; rose 4 po<strong>in</strong>ts Fell 1; rose 1½ po<strong>in</strong>tsGermany No susta<strong>in</strong>ed change No susta<strong>in</strong>ed changeNe<strong>the</strong>rl<strong>and</strong>s Fell 6½ po<strong>in</strong>ts (up to 1999) Fell 3 po<strong>in</strong>ts (up to 1999)Switzerl<strong>and</strong> No susta<strong>in</strong>ed change No susta<strong>in</strong>ed changeIndia Fell 7½; rose 4½ po<strong>in</strong>ts (up to 1999) Fell 4; rose 2½ po<strong>in</strong>ts (up to 1999)Japan No susta<strong>in</strong>ed change up to 1999;rose 1½ po<strong>in</strong>ts between 1999 <strong>and</strong> 2005S<strong>in</strong>gapore No susta<strong>in</strong>ed change from 1960 to 1998;rose 2 po<strong>in</strong>ts between 1998 <strong>and</strong> 2005No susta<strong>in</strong>ed change up to 1999;rose ¾ po<strong>in</strong>t between 1999 <strong>and</strong> 2005No susta<strong>in</strong>ed change from 1960 to 1990s;rose 2 po<strong>in</strong>ts between 1990s <strong>and</strong> 2005Argent<strong>in</strong>a Fell 12; rose 4 po<strong>in</strong>ts Fell 5½; rose 3 po<strong>in</strong>tsSweden Fell 3½; rose 2 po<strong>in</strong>ts Fell 1¼; rose 1¼ po<strong>in</strong>tsF<strong>in</strong>l<strong>and</strong> Rose 2 po<strong>in</strong>ts up to early 1960s; fell 6po<strong>in</strong>ts; rose 3½ po<strong>in</strong>tsNorway Fell 4½; rose 8 po<strong>in</strong>ts Fell 1¾; rose 4½ po<strong>in</strong>tsNotes:(1) “No change” means change less than 2 percentage po<strong>in</strong>ts for top 1 percent;less than 0.65 percentage po<strong>in</strong>t for top 0.1 percent.(2) Data coverage <strong>in</strong>complete for part <strong>of</strong> <strong>the</strong> period for Argent<strong>in</strong>a.Source: Atk<strong>in</strong>son <strong>and</strong> Picketty (2007, 2010).In France, after an <strong>in</strong>itial reduction <strong>in</strong> concentration,<strong>the</strong> top 1 percent <strong>in</strong>come sharehas begun to rise s<strong>in</strong>ce <strong>the</strong> late 1990s (figure9). In Japan <strong>and</strong> S<strong>in</strong>gapore, <strong>the</strong> rebound<strong>in</strong> recent years is even more pronounced(figures 9 <strong>and</strong> 11). The only three countries<strong>with</strong> no sign <strong>of</strong> a rise <strong>in</strong> <strong>in</strong>come concentrationdur<strong>in</strong>g <strong>the</strong> most recent period, namelySwitzerl<strong>and</strong>, Germany, <strong>and</strong> <strong>the</strong> Ne<strong>the</strong>rl<strong>and</strong>s,are countries where our series stop <strong>in</strong> <strong>the</strong>late 1990s. There exists some reasonablepresumption that when data become availablefor <strong>the</strong> 2000s, <strong>the</strong>se countries mightalso display an upward trend. F<strong>in</strong>ally, notethat Switzerl<strong>and</strong> <strong>and</strong> especially Germanyhave always been characterized by a significantlylarger concentration at <strong>the</strong> top thano<strong>the</strong>r cont<strong>in</strong>ental European countries. Thisis also apparent <strong>in</strong> <strong>the</strong> observed patterns <strong>of</strong>Pareto β coefficients, which more generallydepict <strong>the</strong> same contrast between L-shaped<strong>and</strong> U-shaped countries as top <strong>in</strong>come shares(see figures 12 <strong>and</strong> 13).What about countries for which we haveonly a shorter time series? The time series forCh<strong>in</strong>a is <strong>in</strong>deed short, but <strong>the</strong>re too <strong>the</strong> top
- Page 5 and 6: Atkinson, Piketty, and Saez: Top In
- Page 7 and 8: Atkinson, Piketty, and Saez: Top In
- Page 9 and 10: Atkinson, Piketty, and Saez: Top In
- Page 11 and 12: Atkinson, Piketty, and Saez: Top In
- Page 13 and 14: Atkinson, Piketty, and Saez: Top In
- Page 15 and 16: Atkinson, Piketty, and Saez: Top In
- Page 17 and 18: Atkinson, Piketty, and Saez: Top In
- Page 19 and 20: Atkinson, Piketty, and Saez: Top In
- Page 21 and 22: Atkinson, Piketty, and Saez: Top In
- Page 23 and 24: Atkinson, Piketty, and Saez: Top In
- Page 25 and 26: Atkinson, Piketty, and Saez: Top In
- Page 27 and 28: Atkinson, Piketty, and Saez: Top In
- Page 29 and 30: Atkinson, Piketty, and Saez: Top In
- Page 31 and 32: Atkinson, Piketty, and Saez: Top In
- Page 33 and 34: Atkinson, Piketty, and Saez: Top In
- Page 35 and 36: Atkinson, Piketty, and Saez: Top In
- Page 37 and 38: Atkinson, Piketty, and Saez: Top In
- Page 39 and 40: Atkinson, Piketty, and Saez: Top In
- Page 41 and 42: Atkinson, Piketty, and Saez: Top In
- Page 43 and 44: Atkinson, Piketty, and Saez: Top In
- Page 45: Atkinson, Piketty, and Saez: Top In
- Page 49 and 50: Atkinson, Piketty, and Saez: Top In
- Page 51 and 52: Atkinson, Piketty, and Saez: Top In
- Page 53 and 54: Atkinson, Piketty, and Saez: Top In
- Page 55 and 56: Atkinson, Piketty, and Saez: Top In
- Page 57 and 58: Atkinson, Piketty, and Saez: Top In
- Page 59 and 60: Atkinson, Piketty, and Saez: Top In
- Page 61 and 62: Atkinson, Piketty, and Saez: Top In
- Page 63 and 64: Atkinson, Piketty, and Saez: Top In
- Page 65 and 66: Atkinson, Piketty, and Saez: Top In
- Page 67 and 68: Atkinson, Piketty, and Saez: Top In
- Page 69: Atkinson, Piketty, and Saez: Top In